
Stake attention in this memory
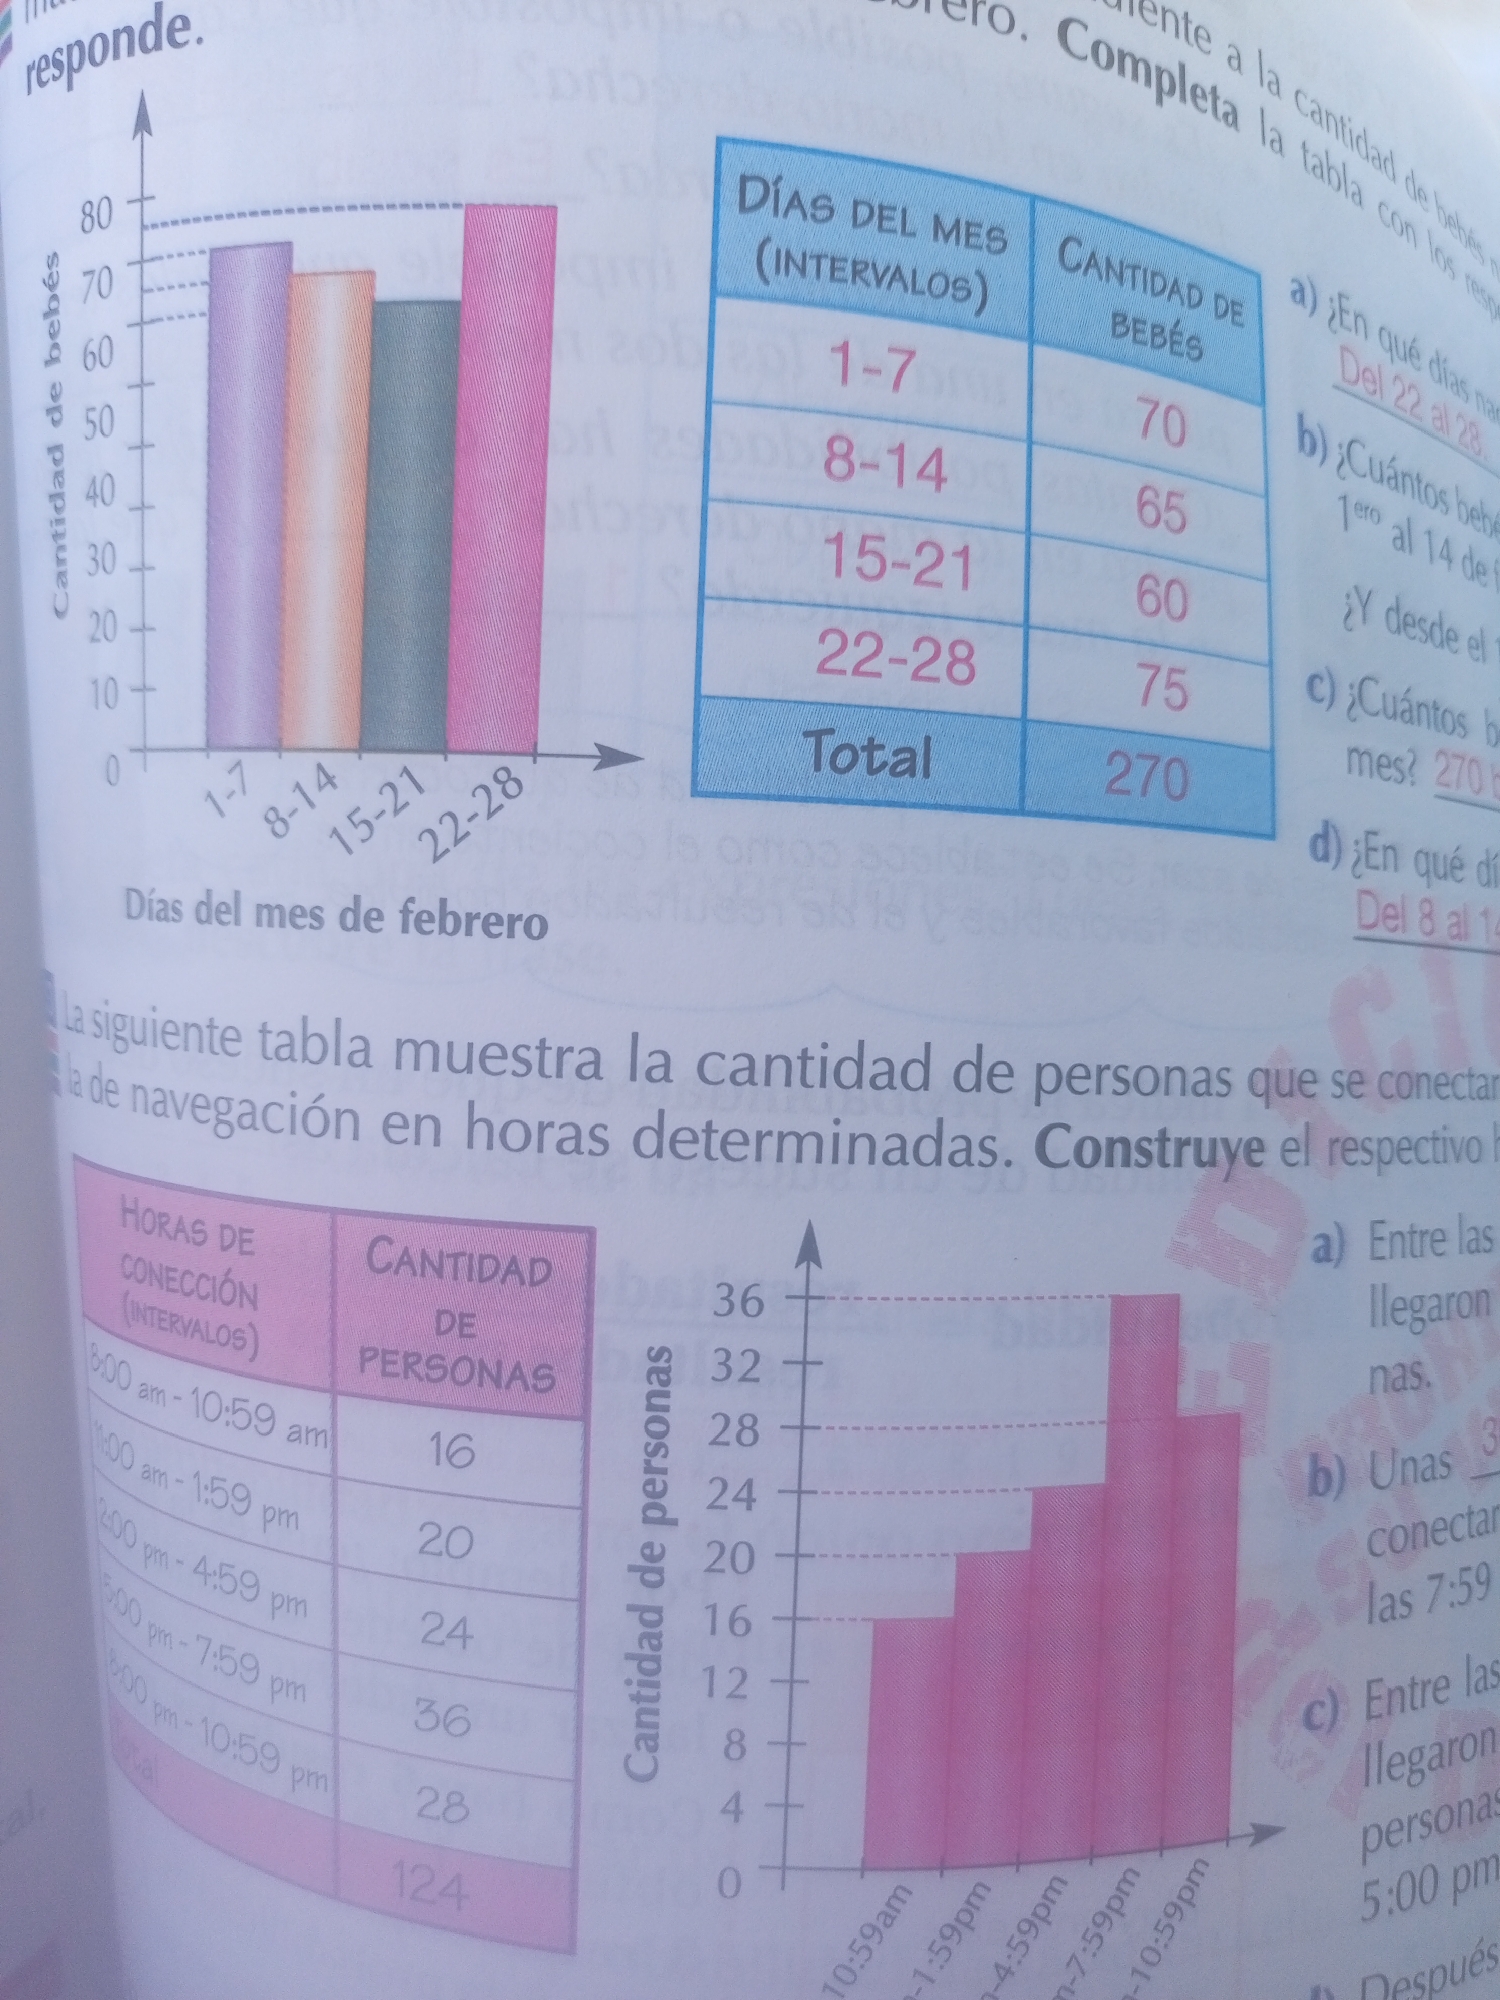
This is a photograph of an open textbook page, likely in a classroom setting. The page contains educational material, primarily focused on data representation through bar graphs and tables. The top left of the page features a bar graph depicting the "Cantidad de bebés" (Quantity of babies) across different "Días del mes de febrero" (Days of the month of February), with intervals of 1-7, 8-14, 15-21, and 22-28. The y-axis ranges from 0 to 80. To the right of the bar graph is a table with two columns: "DÍAS DEL MES (INTERVALOS)" and "CANTIDAD DE BEBÉS". This table reiterates the data from the bar graph, showing the number of babies for each interval: 70, 65, 60, and 75, with a total of 270. Below this table, there are questions labeled a) through d) related to the data presented. The bottom half of the page presents another table and a corresponding bar graph. The table is titled "HORAS DE CONECCIÓN (INTERVALOS)" and "CANTIDAD DE PERSONAS". It shows intervals of connection times from 8:00 am to 10:59 pm and the corresponding number of people. The intervals are 8:00 am - 10:59 am (16 people), 11:00 am - 1:59 pm (20 people), 2:00 pm - 4:59 pm (24 people), 5:00 pm - 7:59 pm (36 people), and 8:00 pm - 10:59 pm (28 people), with a total of 124 people. The bar graph visually represents this data, with the y-axis labeled "Cantidad de personas" and the x-axis showing the time intervals. Similar to the top section, there are questions labeled a) through d) related to this second dataset. The overall impression is that of a schoolbook page designed to teach students how to interpret and analyze data presented in graphical and tabular formats. There are no visible people or specific location cues beyond the context of a textbook.
Symbol
AE8A1
Volume
5,647
Creator
+$0.07
Revenue
+$0.04
TVL
$2.70
Loading AttnAds…
2

Rev Bot 🤖💰
Injected revenue 27d ago
“Revenue bonus for the last stake.”
+$0.07 USD
4
Rev Bot 🤖💰
Injected revenue 26d ago
“Revenue bonus for the last stake.”
+$0.07 USD