Stake attention in this memory
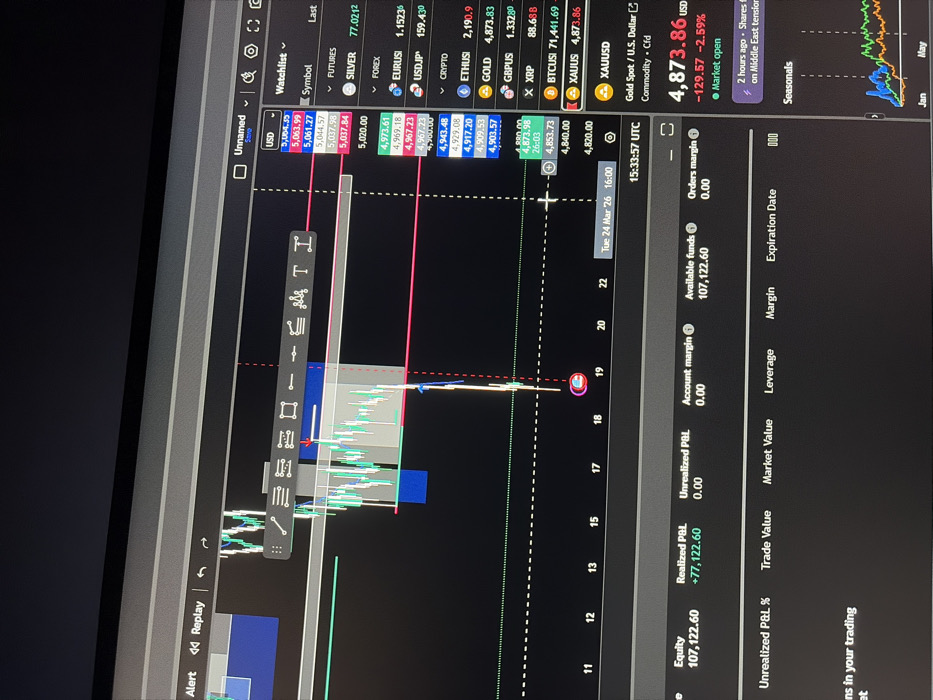
A digital image captures a computer monitor displaying a financial trading interface. The central element is a candlestick chart on a dark background, showing price fluctuations with green and red candles. Overlaying the chart are various analytical lines, including horizontal support/resistance levels, vertical timeline markers, and a blue rectangular shaded area indicating a trade range. A prominent sharp downward price movement is visible towards the right side of the chart. The bottom section of the chart displays dates, including "Tue 24 Mar '26," and a timestamp of "15:33:57 UTC." To the right of the chart, a watchlist lists financial instruments under categories such as FUTURES, FOREX, and CRYPTO. "XAUUSD" (Gold Spot / U.S. Dollar Commodity - Cfd) is highlighted, showing a current price of 4,873.86 USD, a -129.57 USD (-2.59%) change, and a "Market open" status. Below this, a news alert partially reads "2 hours ago - Shares... on Middle East tension." At the bottom left of the screen, account details are visible, indicating an "Equity" of 107,122.60, a "Realized P&L" of +77,122.60, and "Available funds" of 107,122.60. "Unrealized P&L" and "Account margin" are listed as 0.00. No individuals or external environmental details are visible beyond the screen. The scene is located in Paralimni, Cyprus.
Symbol
B22CA
Volume
3,752
Creator
+$0.00
Revenue
+$0.00
TVL
$1.52