Stake attention in this memory
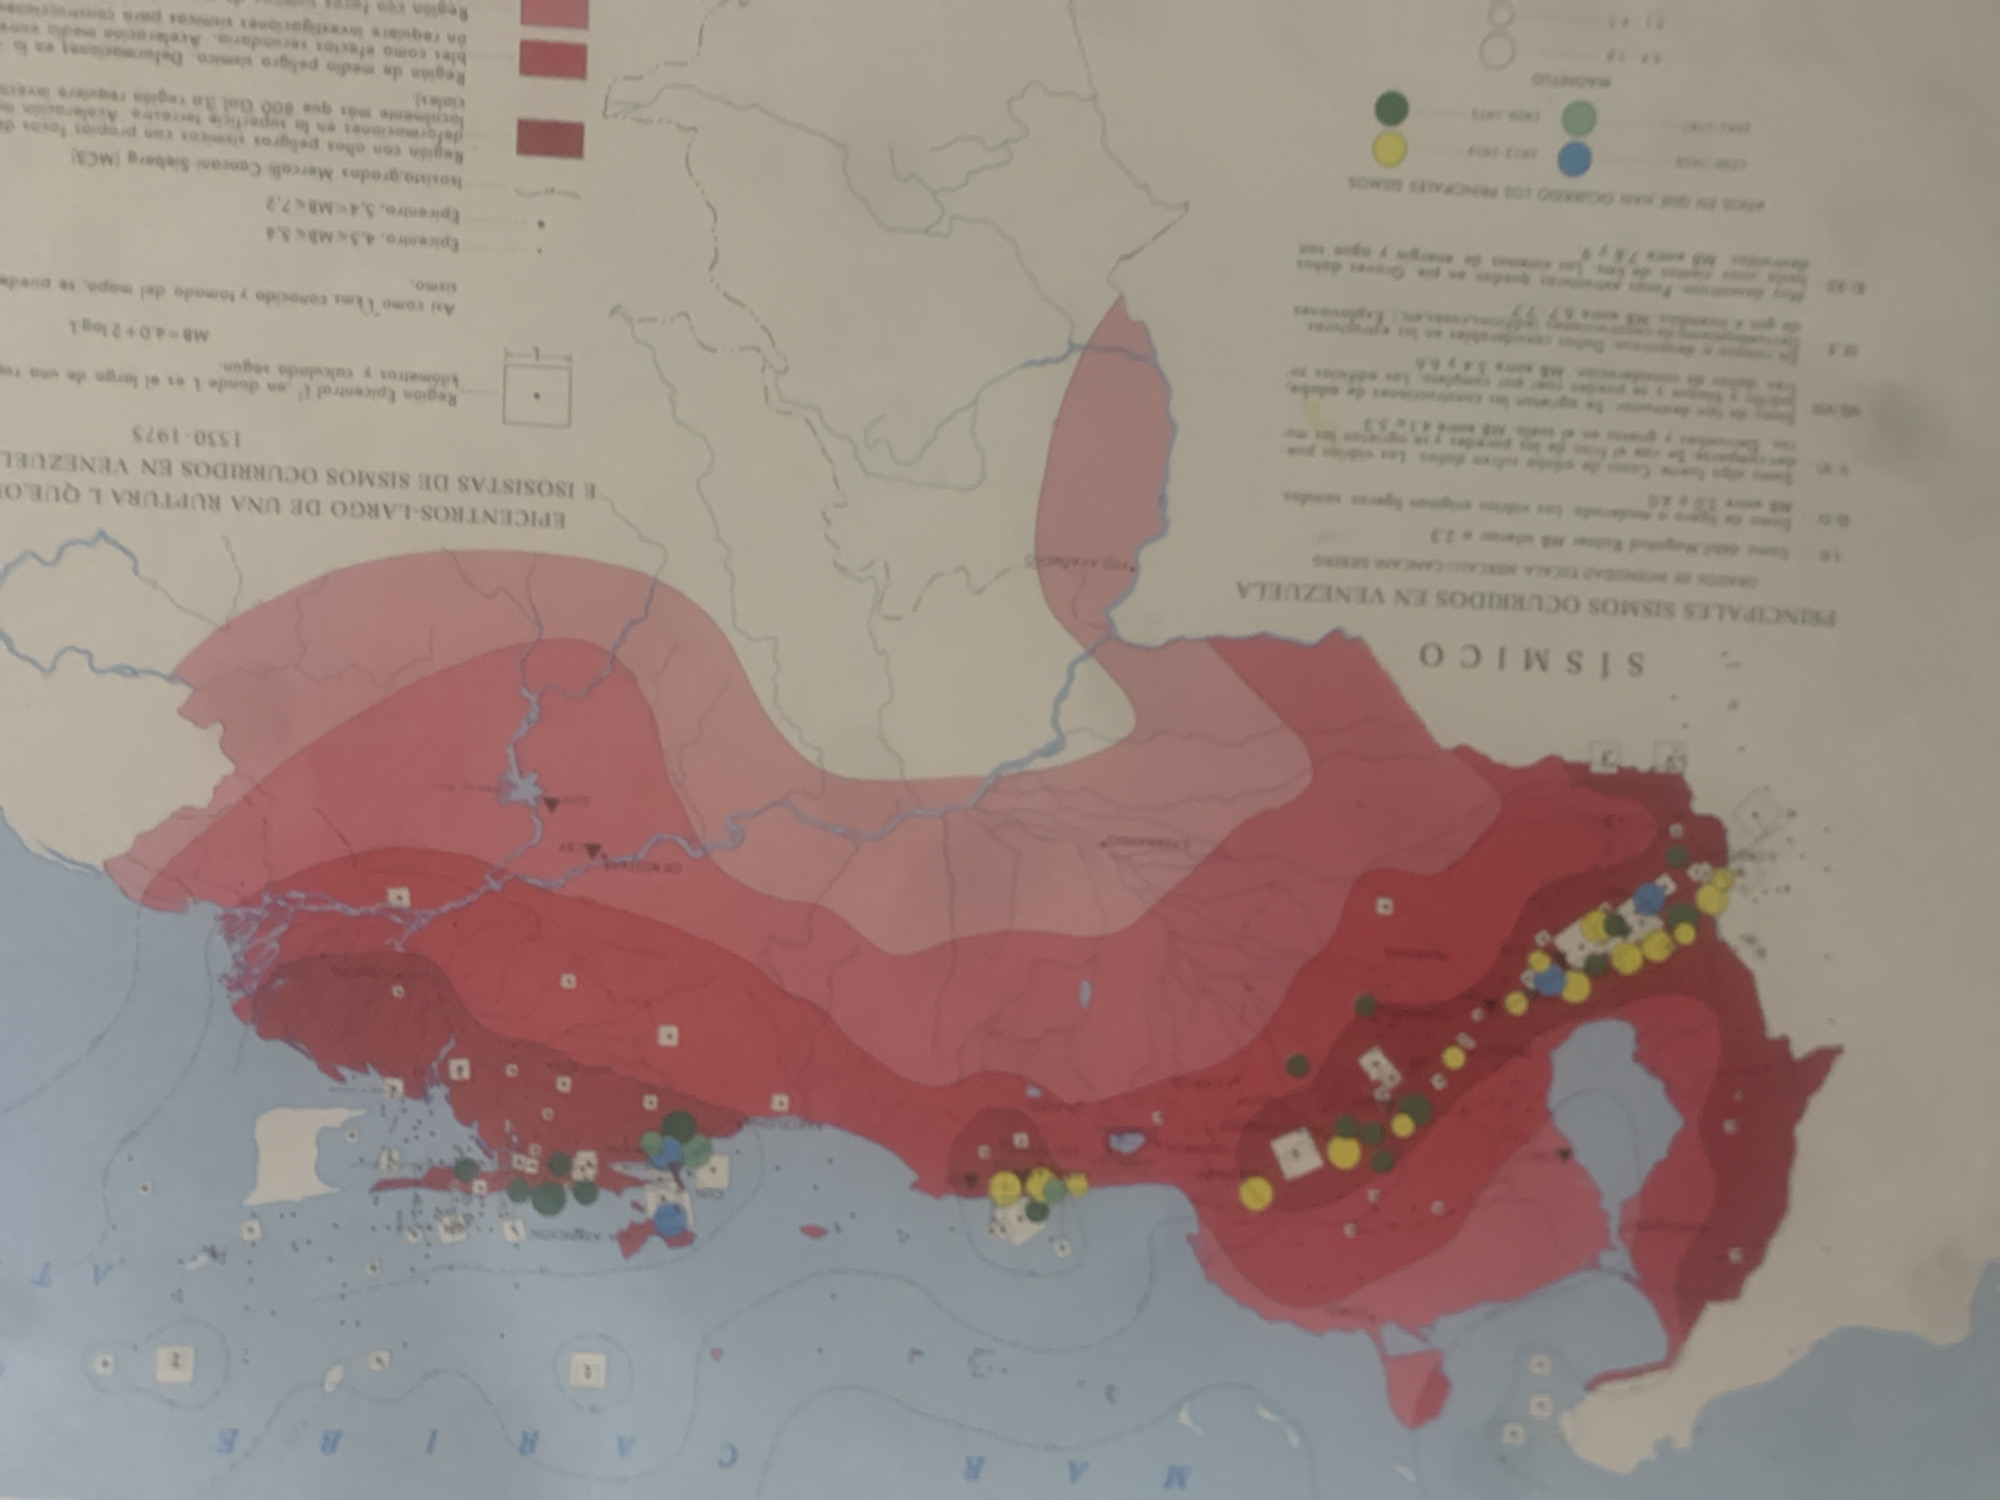
This is a map of seismic activity in Venezuela, specifically around the La Tagua region. The map displays colored contour lines, likely representing seismic intensity or hazard levels, with red indicating higher levels and lighter shades indicating lower levels. Scattered across the map are various colored dots and squares, possibly marking earthquake epicenters or significant seismic events. The text on the map is predominantly in Spanish. Some legible text includes "E ISOSISTAS DE SISMOS OCURRIDOS EN VENEZUELA" (Isosists of Earthquakes Occurred in Venezuela), "PRINCIPALES SISMOS OCUPIDOS EN VENEZUELA" (Principal Earthquakes Occurred in Venezuela), and "SISMO" (Earthquake). There are also references to magnitudes, such as "Mw 8.0 - 4.0 + 2 logl" and earthquake data like "Epicentro, 4.5<Mb<5.4" and "Epicentro, 5.4<Mb<7.2". The map appears to be from the period 1938-1975. The setting is a cartographic representation of geographical and seismic data. There are no visible people or a specific time of day or weather conditions, as it is a static map.
Symbol
B370C
Volume
0
Creator
+$0.03
Revenue
+$0.00
TVL
$0.00
Loading AttnAds…

2

Rev Bot 🤖💰
Injected revenue 2mo ago
“Revenue bonus for the last stake.”
+$0.07 USD