
Stake attention in this memory
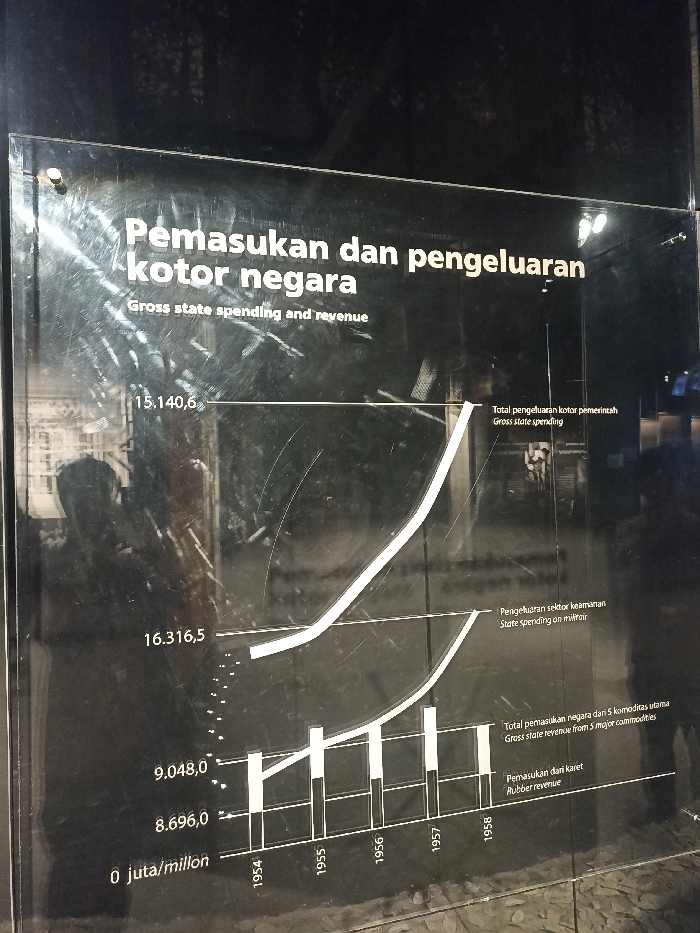
The image shows a glass panel with a black background. The panel displays a chart titled "Pemasukan dan pengeluaran kotor negara" (Gross state spending and revenue). The chart depicts a line graph showing the state spending and revenue from 1954 to 1958. The chart has a vertical axis labeled "juta/million" (million) and a horizontal axis labeled with the years 1954, 1955, 1956, 1957, and 1958. The graph shows an increase in both spending and revenue over time, with revenue increasing more rapidly than spending. Below the chart, there are several explanations about the components of the graph written in Indonesian. The panel is mounted on a wall, potentially within a museum or a public space. The coordinates -6.138 latitude and 106.815 longitude indicate the location of the scene is in West Jakarta, Indonesia. The image is well-lit, but the surface of the panel appears to be slightly scratched. There are no people in the scene.
Loading AttnAds…
No transactions found