Stake attention in this memory
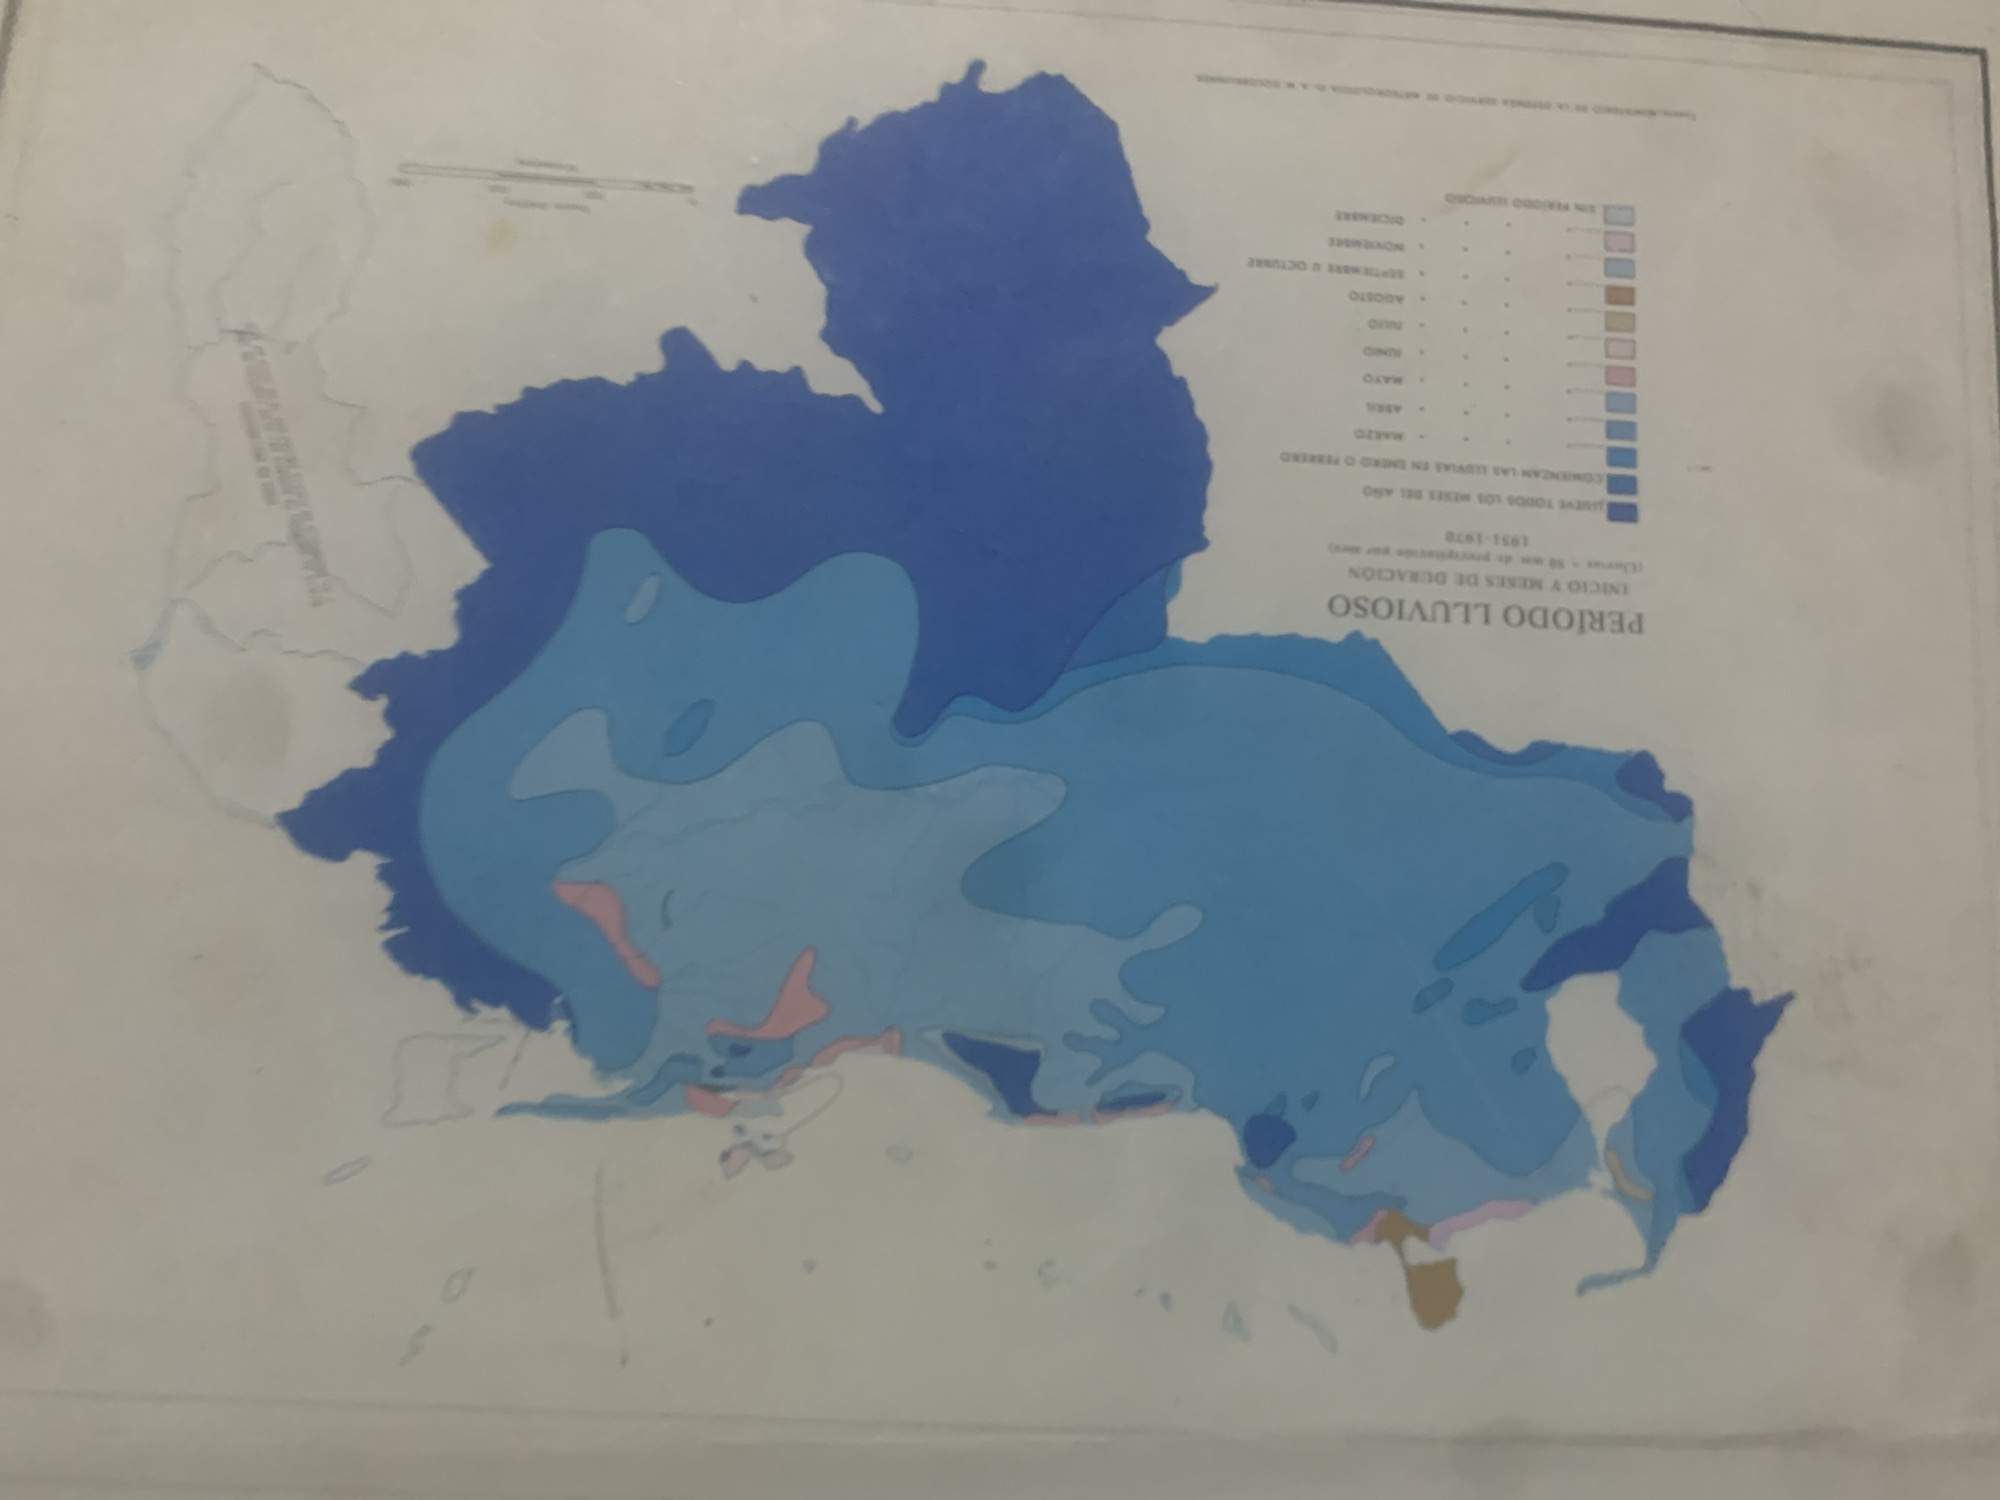
This is an image of a map displaying rainfall patterns for La Tagua, Venezuela, spanning the period of 1951-1970. The map uses colored regions to represent different durations and timings of the rainy season, indicated by Spanish text. A legend on the right side of the map correlates months with specific colors, showing when the rainy season begins and ends, and which months receive rainfall. For instance, the legend lists months from January/February through December, with corresponding color swatches. Some areas are labeled as having rain throughout the year. The overall tone of the map is informative and scientific, aiming to convey meteorological data visually. The map itself is faded and appears to be a printed document, possibly from a meteorological or geographical study. There are no people or specific scenes depicted, only the geographical representation of rainfall data. The background is a light, muted color, and the map is dominated by shades of blue, with some pink and brown accents for specific regions.
Symbol
B5217
Volume
11,550
Creator
+$0.14
Revenue
+$0.25
TVL
$11.69
2
Rev Bot 🤖💰
Injected revenue 6d ago
“Revenue bonus for the last stake.”
+$0.28 USD