
Stake attention in this memory
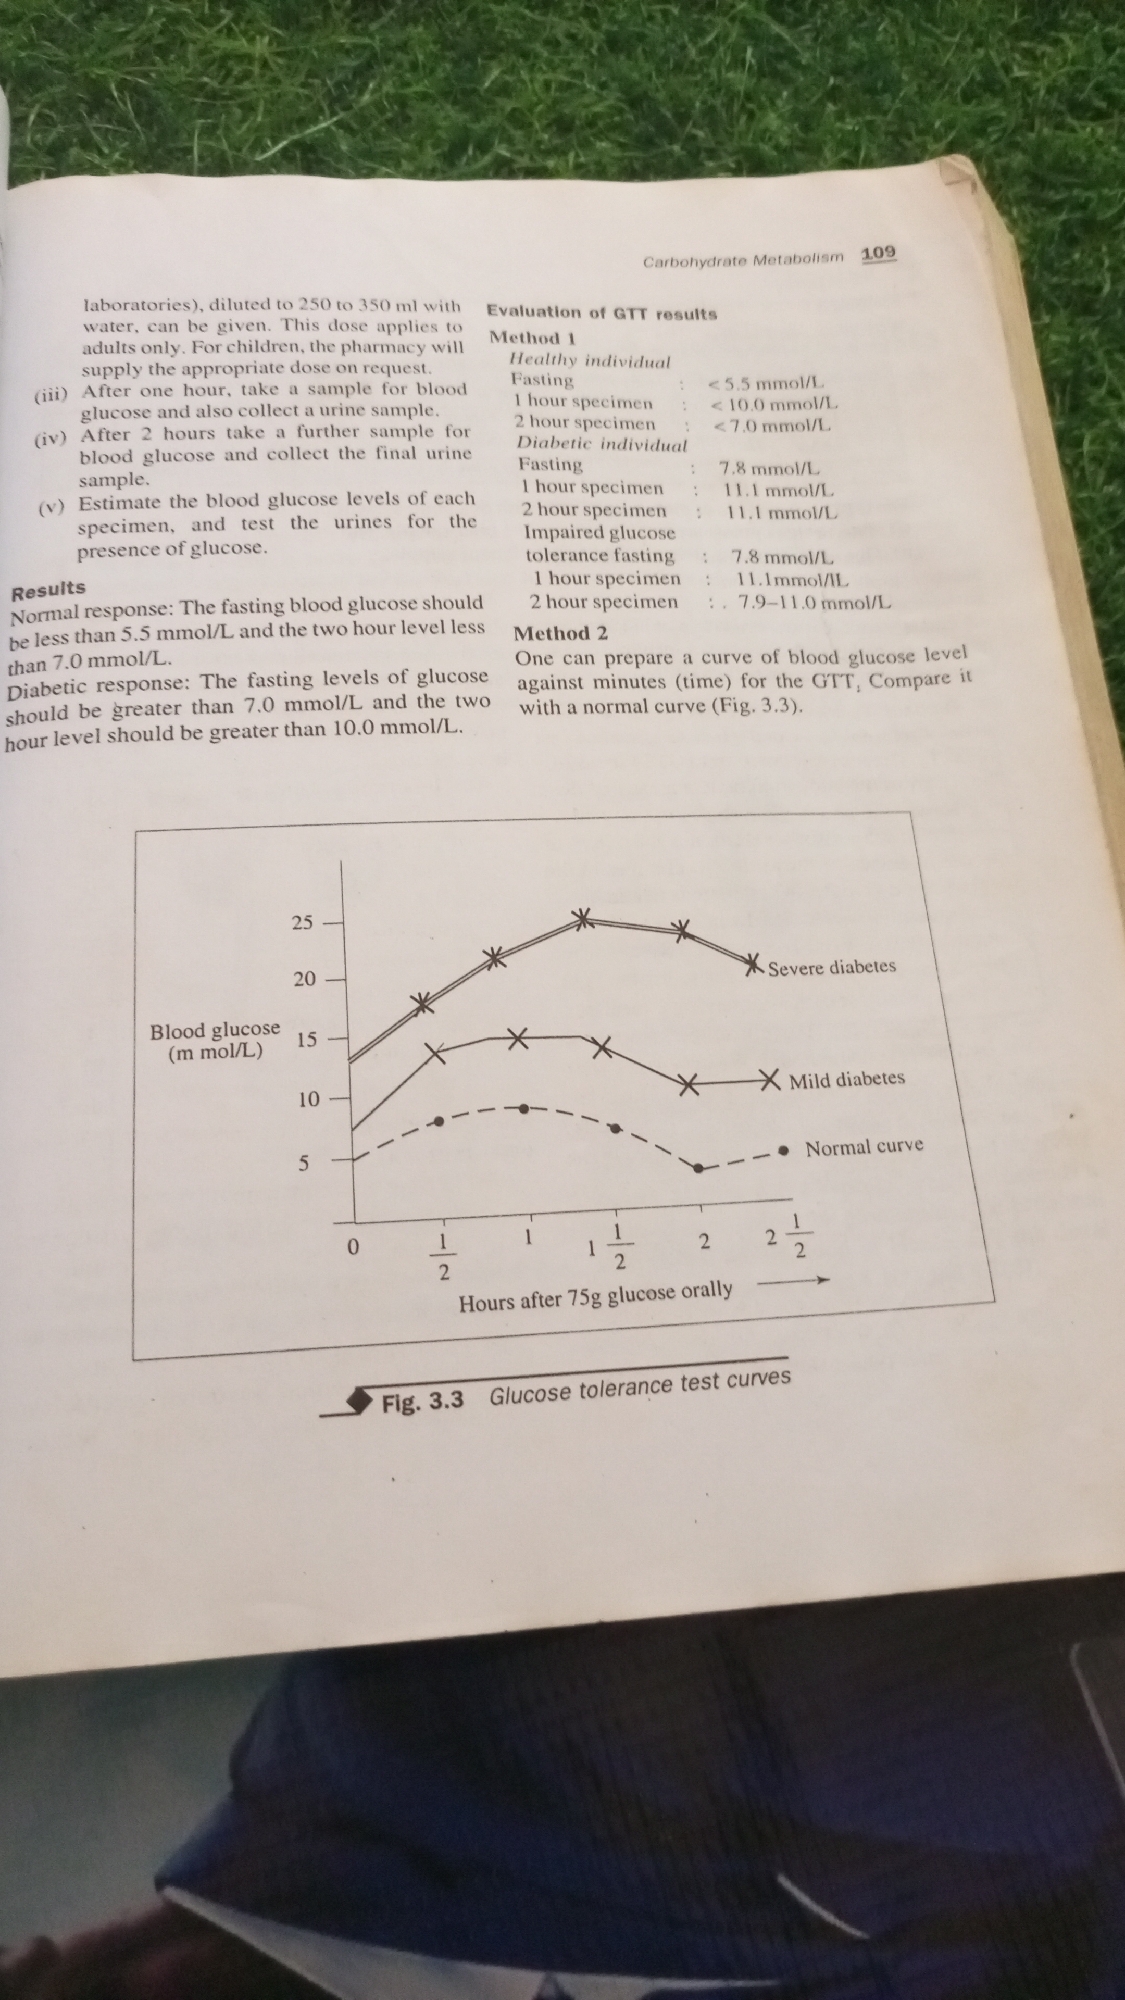
This media file contains a page from a textbook, likely a biology or medical textbook, discussing carbohydrate metabolism and glucose tolerance tests. The page includes text and a graph. The text describes the procedure and interpretation of Glucose Tolerance Tests (GTT). It outlines methods for collecting blood and urine samples at different time intervals after consuming a glucose drink and provides reference values for healthy individuals, diabetics, and those with impaired glucose tolerance. A table summarizes GTT results for different categories. Below the text is a line graph titled "Fig. 3.3 Glucose tolerance test curves." The graph plots "Blood glucose (m mol/L)" on the y-axis against "Hours after 75g glucose orally" on the x-axis. Three curves are depicted: a "Normal curve" (dotted line with circles), a "Mild diabetes" curve (solid line with crosses), and a "Severe diabetes" curve (solid line with asterisks). The graph illustrates how blood glucose levels change over time in response to the glucose challenge for each category. The surrounding environment suggests the image was taken in Jalingo, Nigeria. The lighting and the presence of what appears to be a green, grassy surface in the foreground might indicate an outdoor setting or a room with natural light and plants. The book is open, and the page is slightly creased, suggesting it is a used textbook. There are no people or animals visible. The overall impression is of an educational resource being presented.
Symbol
B7296
Volume
1,813
Creator
+$0.00
Revenue
+$0.00
TVL
$0.09
Loading AttnAds…