Stake attention in this memory
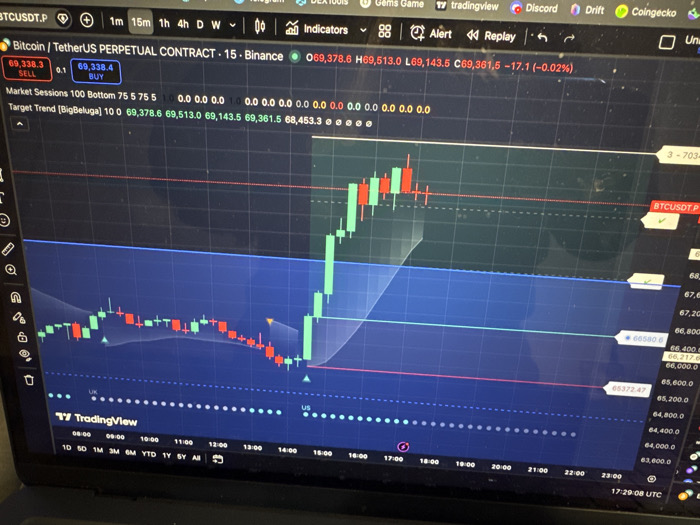
A close-up photograph depicts a dusty laptop or computer screen displaying a financial trading interface. The primary subject is a candlestick chart for "Bitcoin / TetherUS PERPETUAL CONTRACT" traded on Binance, viewed through the TradingView platform. The chart shows price movements over time, with green candlesticks indicating price increases and red candlesticks indicating decreases. Specific price levels are marked by horizontal lines, including 69,378.6, 69,513.0, and 69,143.5 at the top, and 66,580.6 and 65,372.47 lower on the vertical axis, which ranges from approximately 63,600.0 to 70,300.0. The horizontal axis indicates time from 08:00 to 23:00 UTC, with the current time displayed as 17:29:08 UTC. "SELL" and "BUY" buttons are visible with prices 69,338.3 and 69,338.4 respectively. The screen also displays various UI elements, including timeframes (1m, 15m, 1h, 4h), indicators, alerts, and other application icons such as Telegram, DEXtools, Discord, and Coingecko. Geometric shapes, including a large blue shaded area and white diagonal lines, overlay the chart, likely representing technical analysis tools. The physical screen surface exhibits visible dust, smudges, and minor scratches. There are no people, actions, or interactions depicted in the image. The image provides no visual data to determine its physical location, therefore the city of Shumen, Bulgaria, cannot be identified.
No transactions found