
Sign in
This media file is a photograph of a page from a textbook or educational material discussing carbohydrate metabolism and glucose tolerance tests (GTT).

The **subjects** are text and a graph. The text describes different methods for evaluating GTT results, categorizing them into "Healthy individual," "Diabetic individual," and "Impaired glucose tolerance." It also details the steps for performing a GTT and the expected normal and diabetic responses.

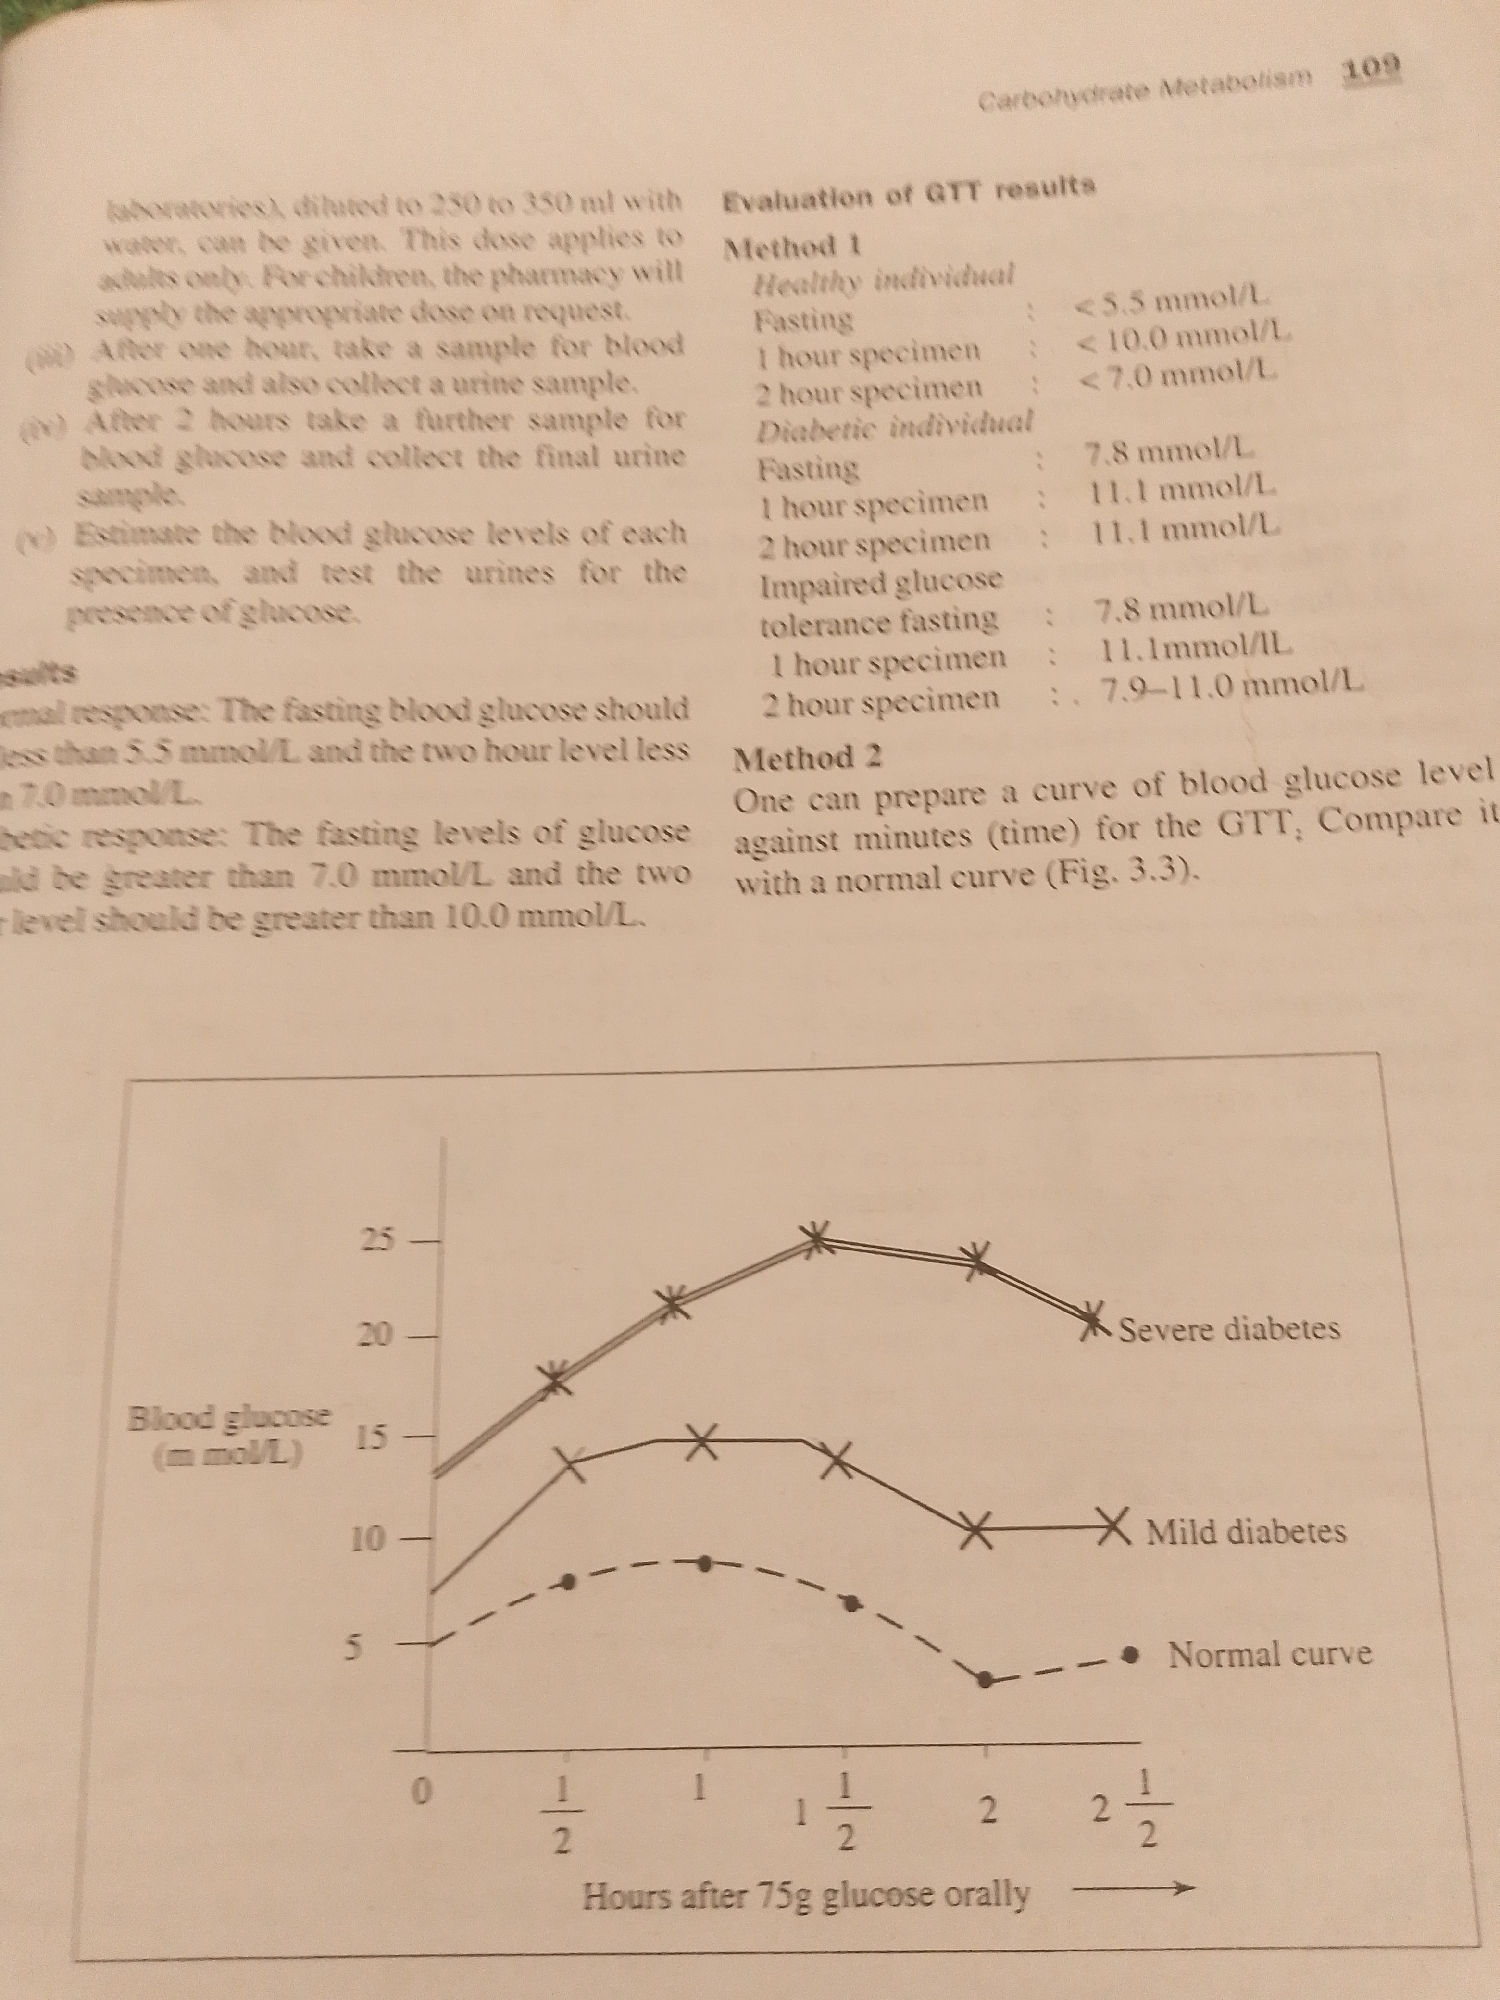
The **activity or event** depicted is the explanation and graphical representation of a glucose tolerance test, a medical diagnostic procedure. The graph shows three curves illustrating blood glucose levels over time after oral glucose intake, labeled "Normal curve," "Mild diabetes," and "Severe diabetes."

**Notable details** in the text include specific blood glucose level ranges in millimoles per liter (mmol/L) for different test results. The graph's x-axis represents "Hours after 75g glucose orally," with measurements taken at 0, 1/2, 1, 2, and 2 1/2 hours. The y-axis represents "Blood glucose (mmol/L)," with values ranging from 0 to 25. The graph displays data points marked with circles for the normal curve and crosses for the mild and severe diabetes curves. The overall setting appears to be an academic or medical context.

**Visible text** includes: "Carbohydrate Metabolism 109," "Evaluation of GTT results," "Method 1," "Healthy individual," "Fasting," "1 hour specimen," "2 hour specimen," "Diabetic individual," "Impaired glucose tolerance fasting," "Method 2," "normal curve (Fig. 3.3)," "Blood glucose (mmol/L)," "Severe diabetes," "Mild diabetes," and "Normal curve," along with numerical values and units.
FM-qTLKq1

Jun 29, 2026, 2:05 PM

Jalingo, Nigeria

Stake attention in this memory

medical
clinical
data
analysis
diagnostic

This media file is a photograph of a page from a textbook or educational material discussing carbohydrate metabolism and glucose tolerance tests (GTT). The **subjects** are text and a graph. The text describes different methods for evaluating GTT results, categorizing them into "Healthy individual," "Diabetic individual," and "Impaired glucose tolerance." It also details the steps for performing a GTT and the expected normal and diabetic responses. The **activity or event** depicted is the explanation and graphical representation of a glucose tolerance test, a medical diagnostic procedure. The graph shows three curves illustrating blood glucose levels over time after oral glucose intake, labeled "Normal curve," "Mild diabetes," and "Severe diabetes." **Notable details** in the text include specific blood glucose level ranges in millimoles per liter (mmol/L) for different test results. The graph's x-axis represents "Hours after 75g glucose orally," with measurements taken at 0, 1/2, 1, 2, and 2 1/2 hours. The y-axis represents "Blood glucose (mmol/L)," with values ranging from 0 to 25. The graph displays data points marked with circles for the normal curve and crosses for the mild and severe diabetes curves. The overall setting appears to be an academic or medical context. **Visible text** includes: "Carbohydrate Metabolism 109," "Evaluation of GTT results," "Method 1," "Healthy individual," "Fasting," "1 hour specimen," "2 hour specimen," "Diabetic individual," "Impaired glucose tolerance fasting," "Method 2," "normal curve (Fig. 3.3)," "Blood glucose (mmol/L)," "Severe diabetes," "Mild diabetes," and "Normal curve," along with numerical values and units.

Loading AttnAds…

transactions
revenues
stakers
Earliest
Latest
Highest stake

No transactions found

More from this user

More from Jalingo

FM-qTLKq1

Jun 29, 2026, 2:05 PM

Jalingo, Nigeria

Licensed under Creative Commons Attribution 4.0 International License. You are free to share and adapt this content with proper attribution.