
Stake attention in this memory
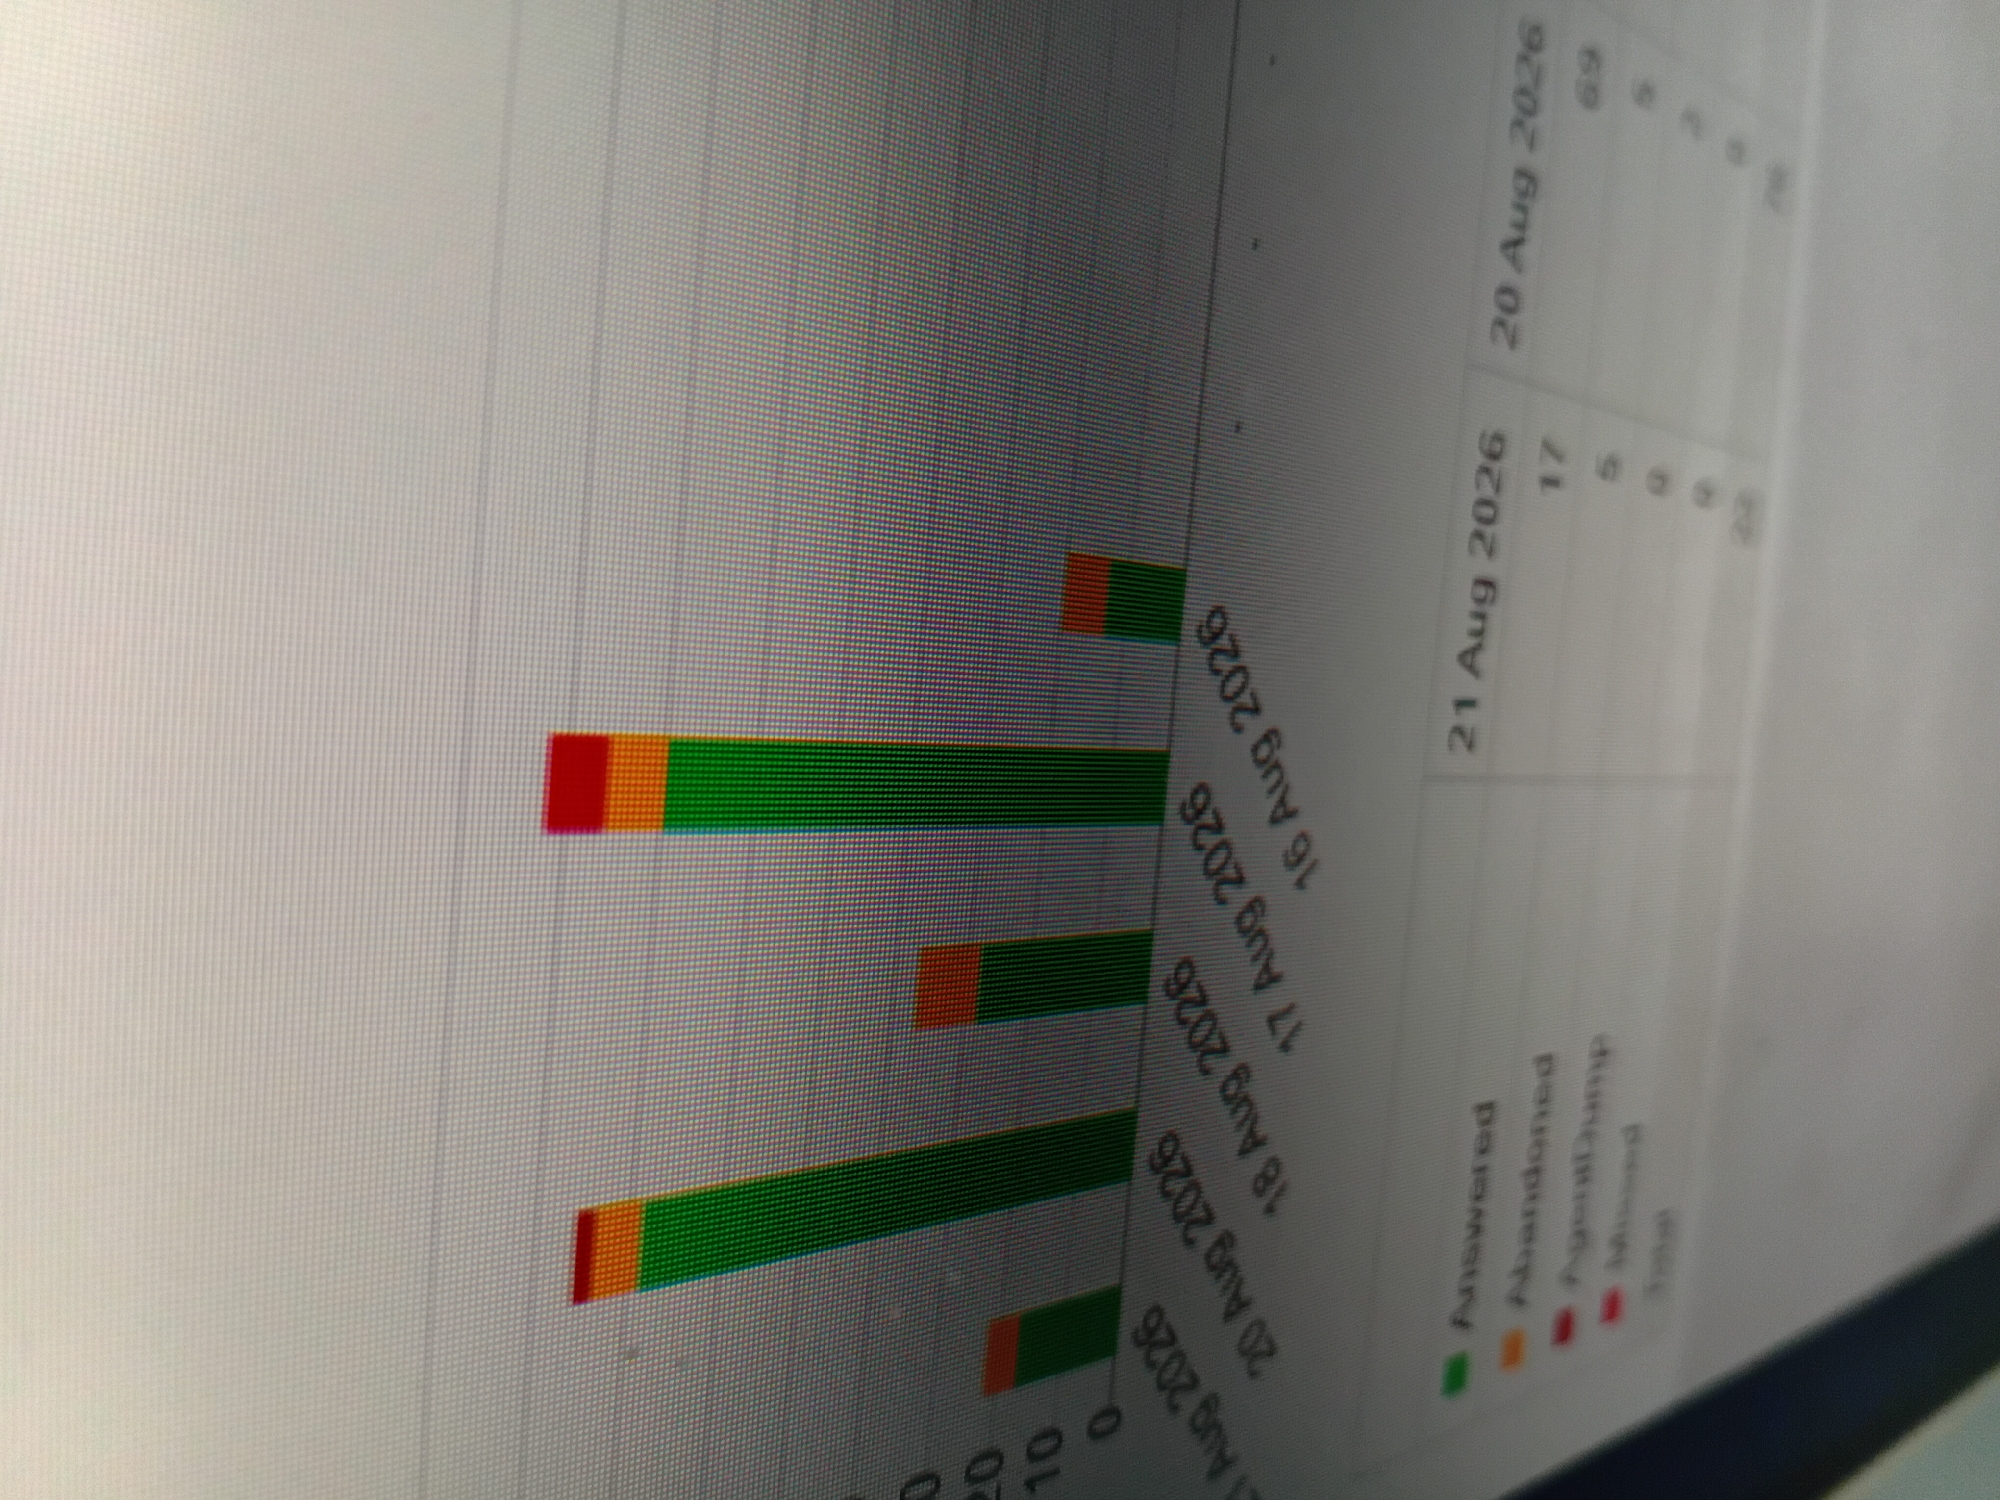
The image shows a digital bar graph displaying data over several dates in August 2026. The dates on the x-axis are arranged in descending order: 21 Aug 2026, 20 Aug 2026, 18 Aug 2026, 17 Aug 2026, and 16 Aug 2026. The bars are stacked and colored green, orange, and red, representing different categories of data, indicated by a legend on the lower left. The legend shows "Answered" (green), "Abandoned" (orange), "AgentDump" (red), and "Missed" (indicated by a red marker). There are numerical values associated with these categories for each date, visible in the table on the right side of the graph. For example, on 21 Aug 2026, there are 17 "Answered", 5 "Abandoned", 9 "AgentDump", and 9 "Missed", with a total of 40. The background is a light gray grid. There are no elements in the image that suggest a location in Mogadishu, Somalia.
Loading AttnAds…
No transactions found
More from this user
More from Mogadishu