Stake attention in this memory
anxiety
uncertainty
focus
analytical
tension
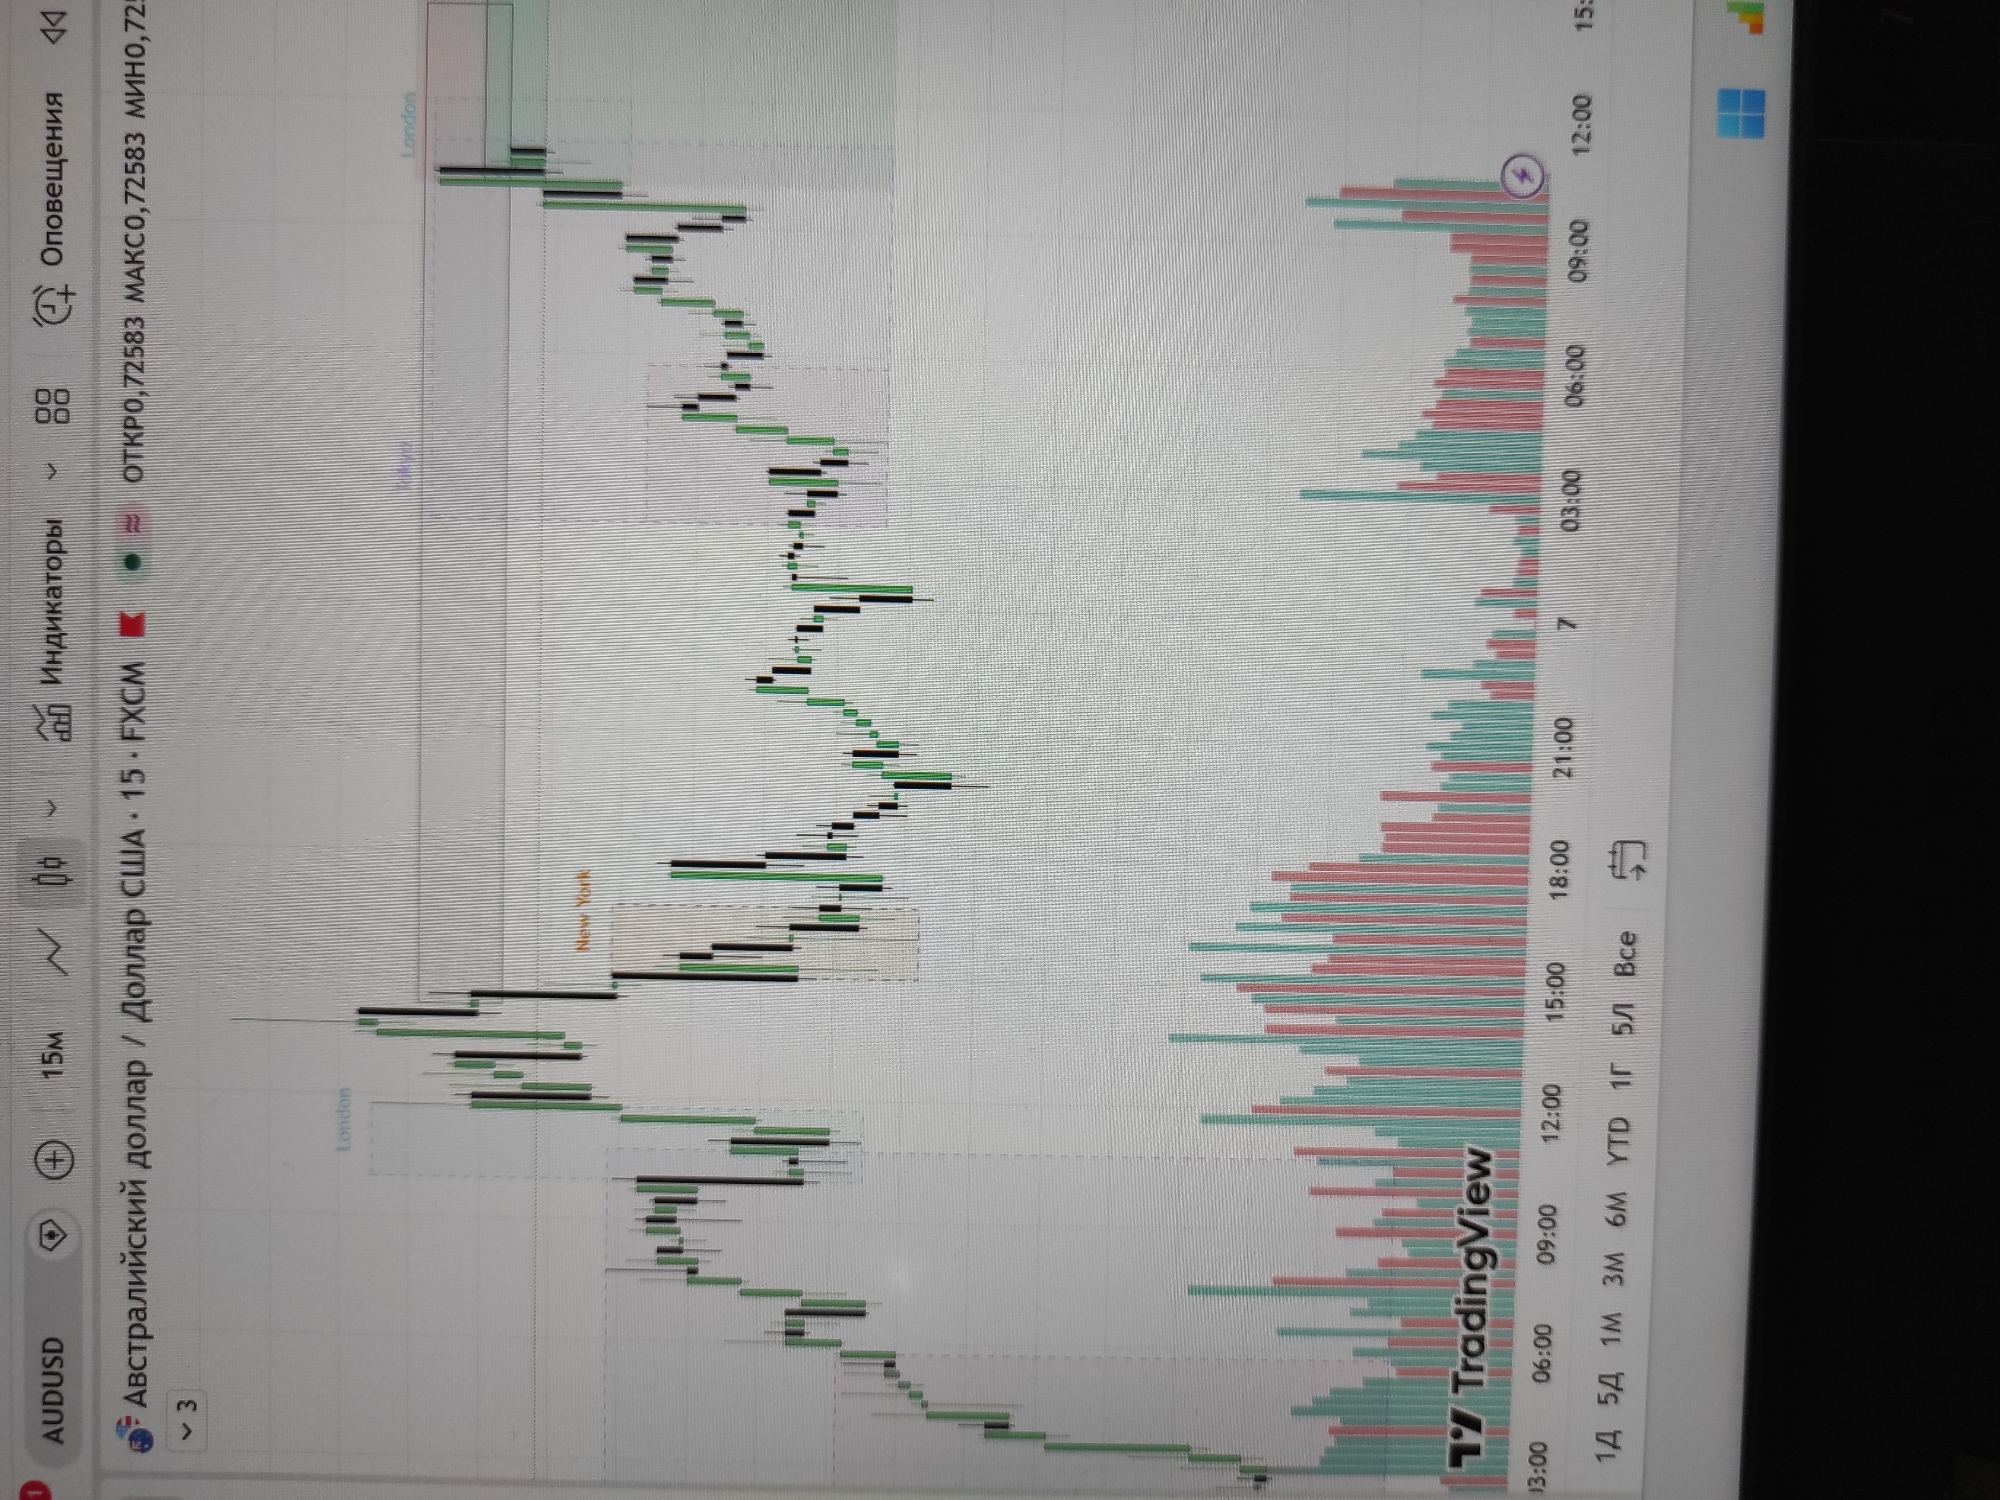
The image shows a screenshot of a TradingView chart. The chart displays the AUD/USD currency pair on a 15-minute timeframe. The chart is a candlestick chart with volume bars at the bottom. There are indicators visible, including lines denoting London and New York trading sessions. The chart shows price action, and the volume bars indicate trading activity.
transactions
revenues
stakers
Earliest
Latest
Highest stake
No transactions found