Stake attention in this memory
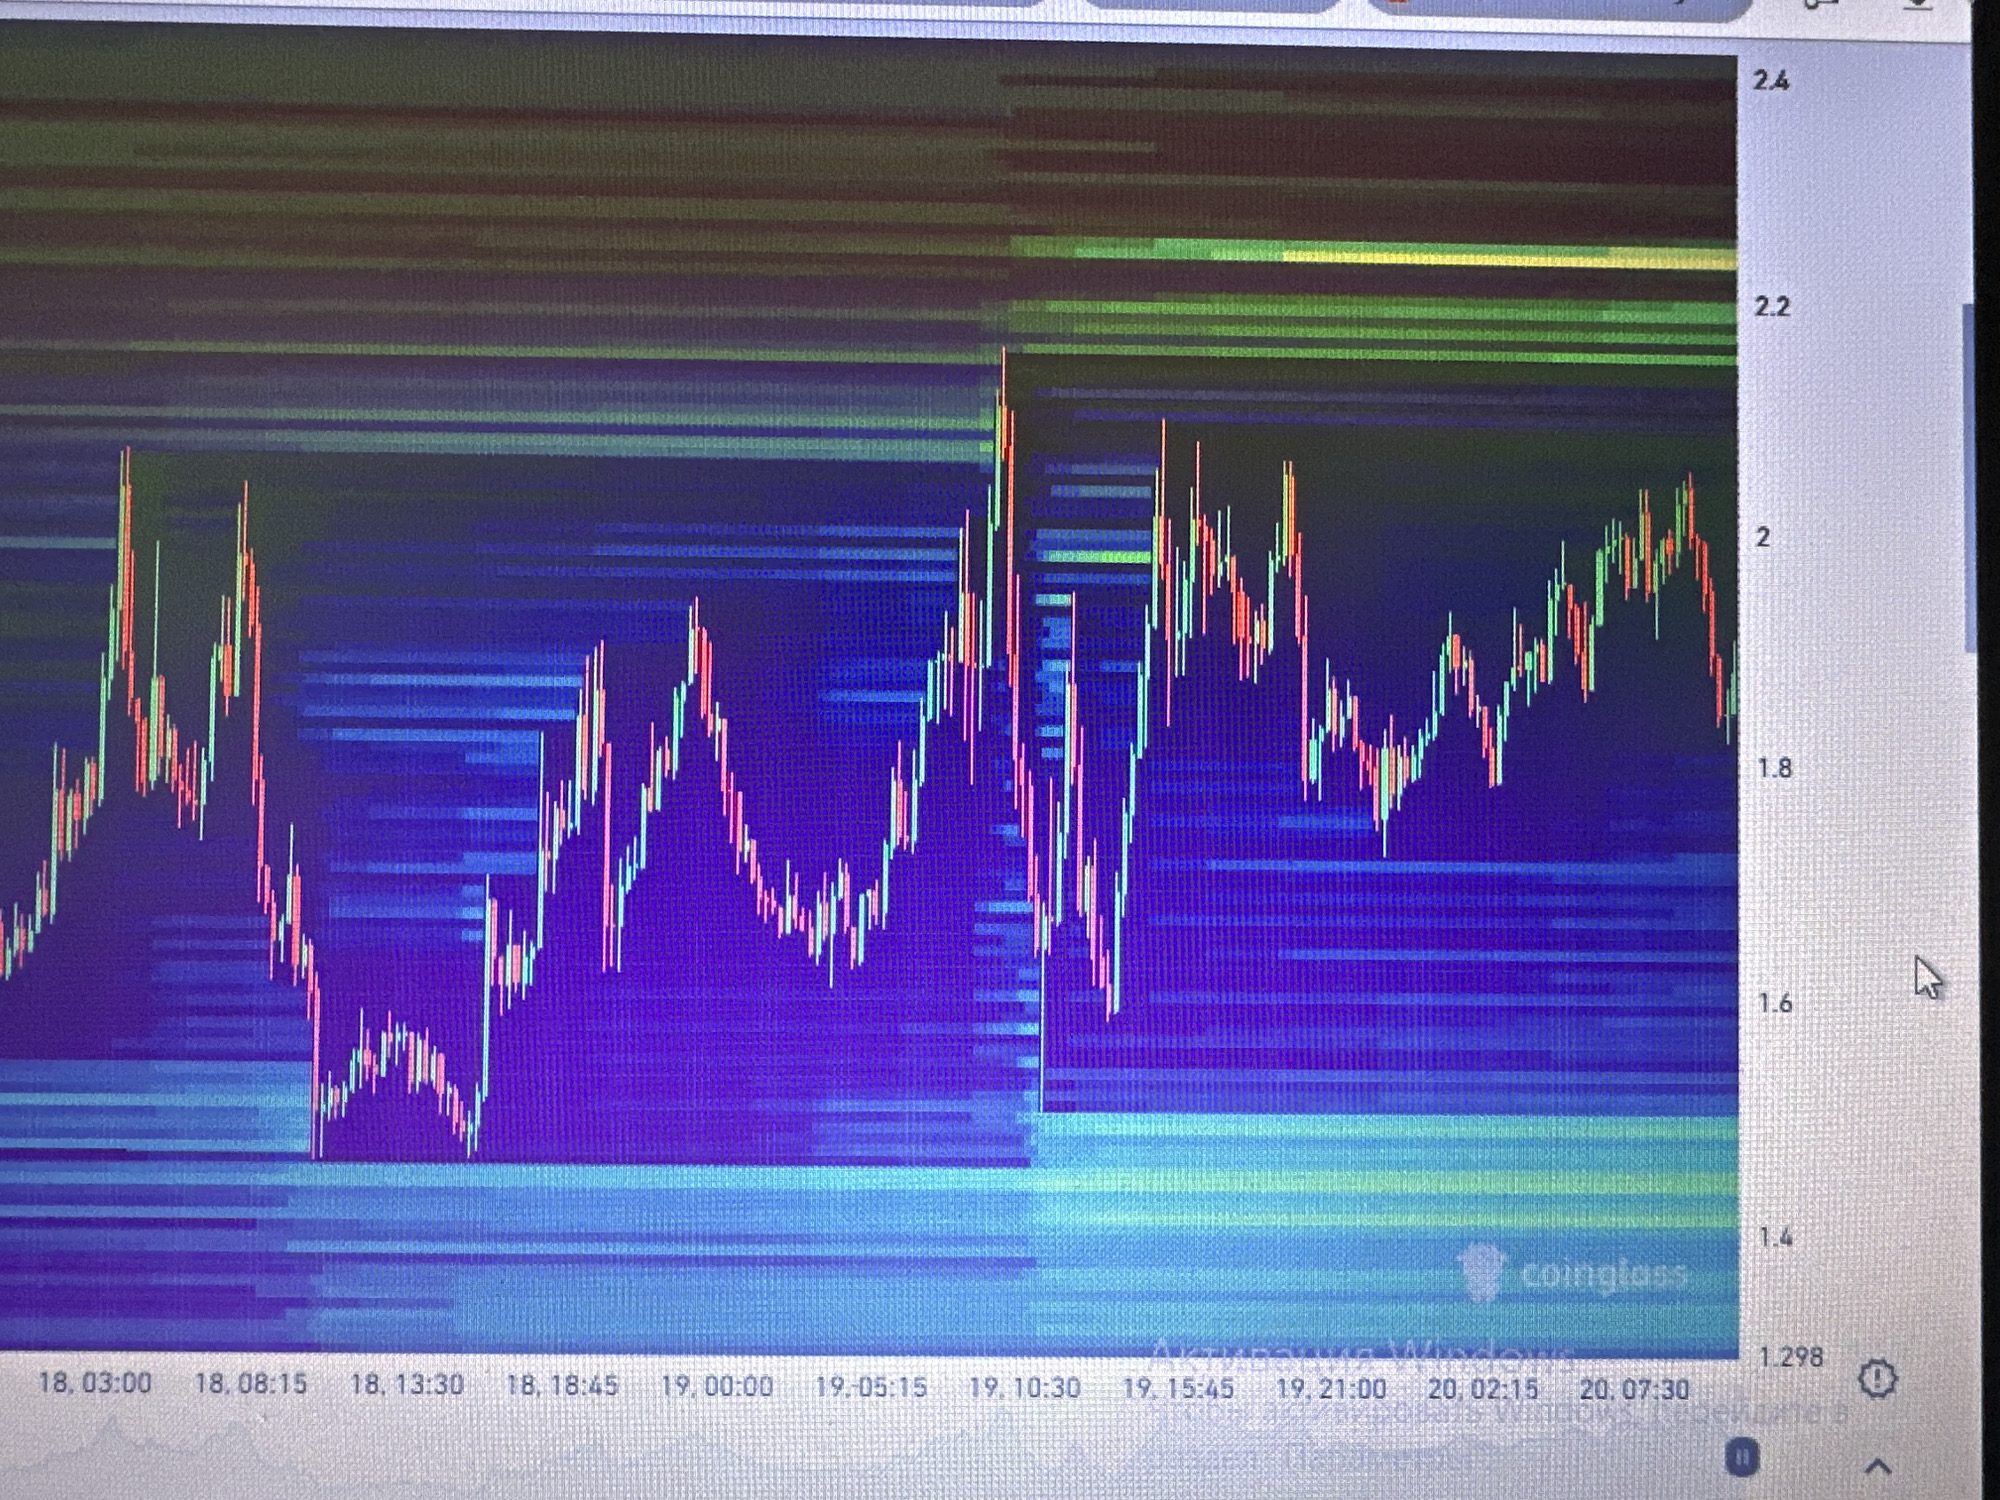
This is a photograph of a computer screen displaying a cryptocurrency trading chart. The chart shows candlestick price movements over a period of time, with red indicating a price decrease and green indicating a price increase. The background of the chart is a gradient of blue and purple, with horizontal lines of green and yellow at the top. A vertical axis on the right side of the screen shows price levels ranging from 1.4 to 2.4. The horizontal axis at the bottom shows time stamps. In the lower right corner, a watermark indicates "coinglass." The image is taken at an angle, suggesting the screen is part of a computer in an indoor setting. There are no people or any identifiable elements of a specific city or location.
Symbol
C8087
Volume
11,605
Creator
+$0.00
Revenue
+$0.00
TVL
$23.03