
Stake attention in this memory
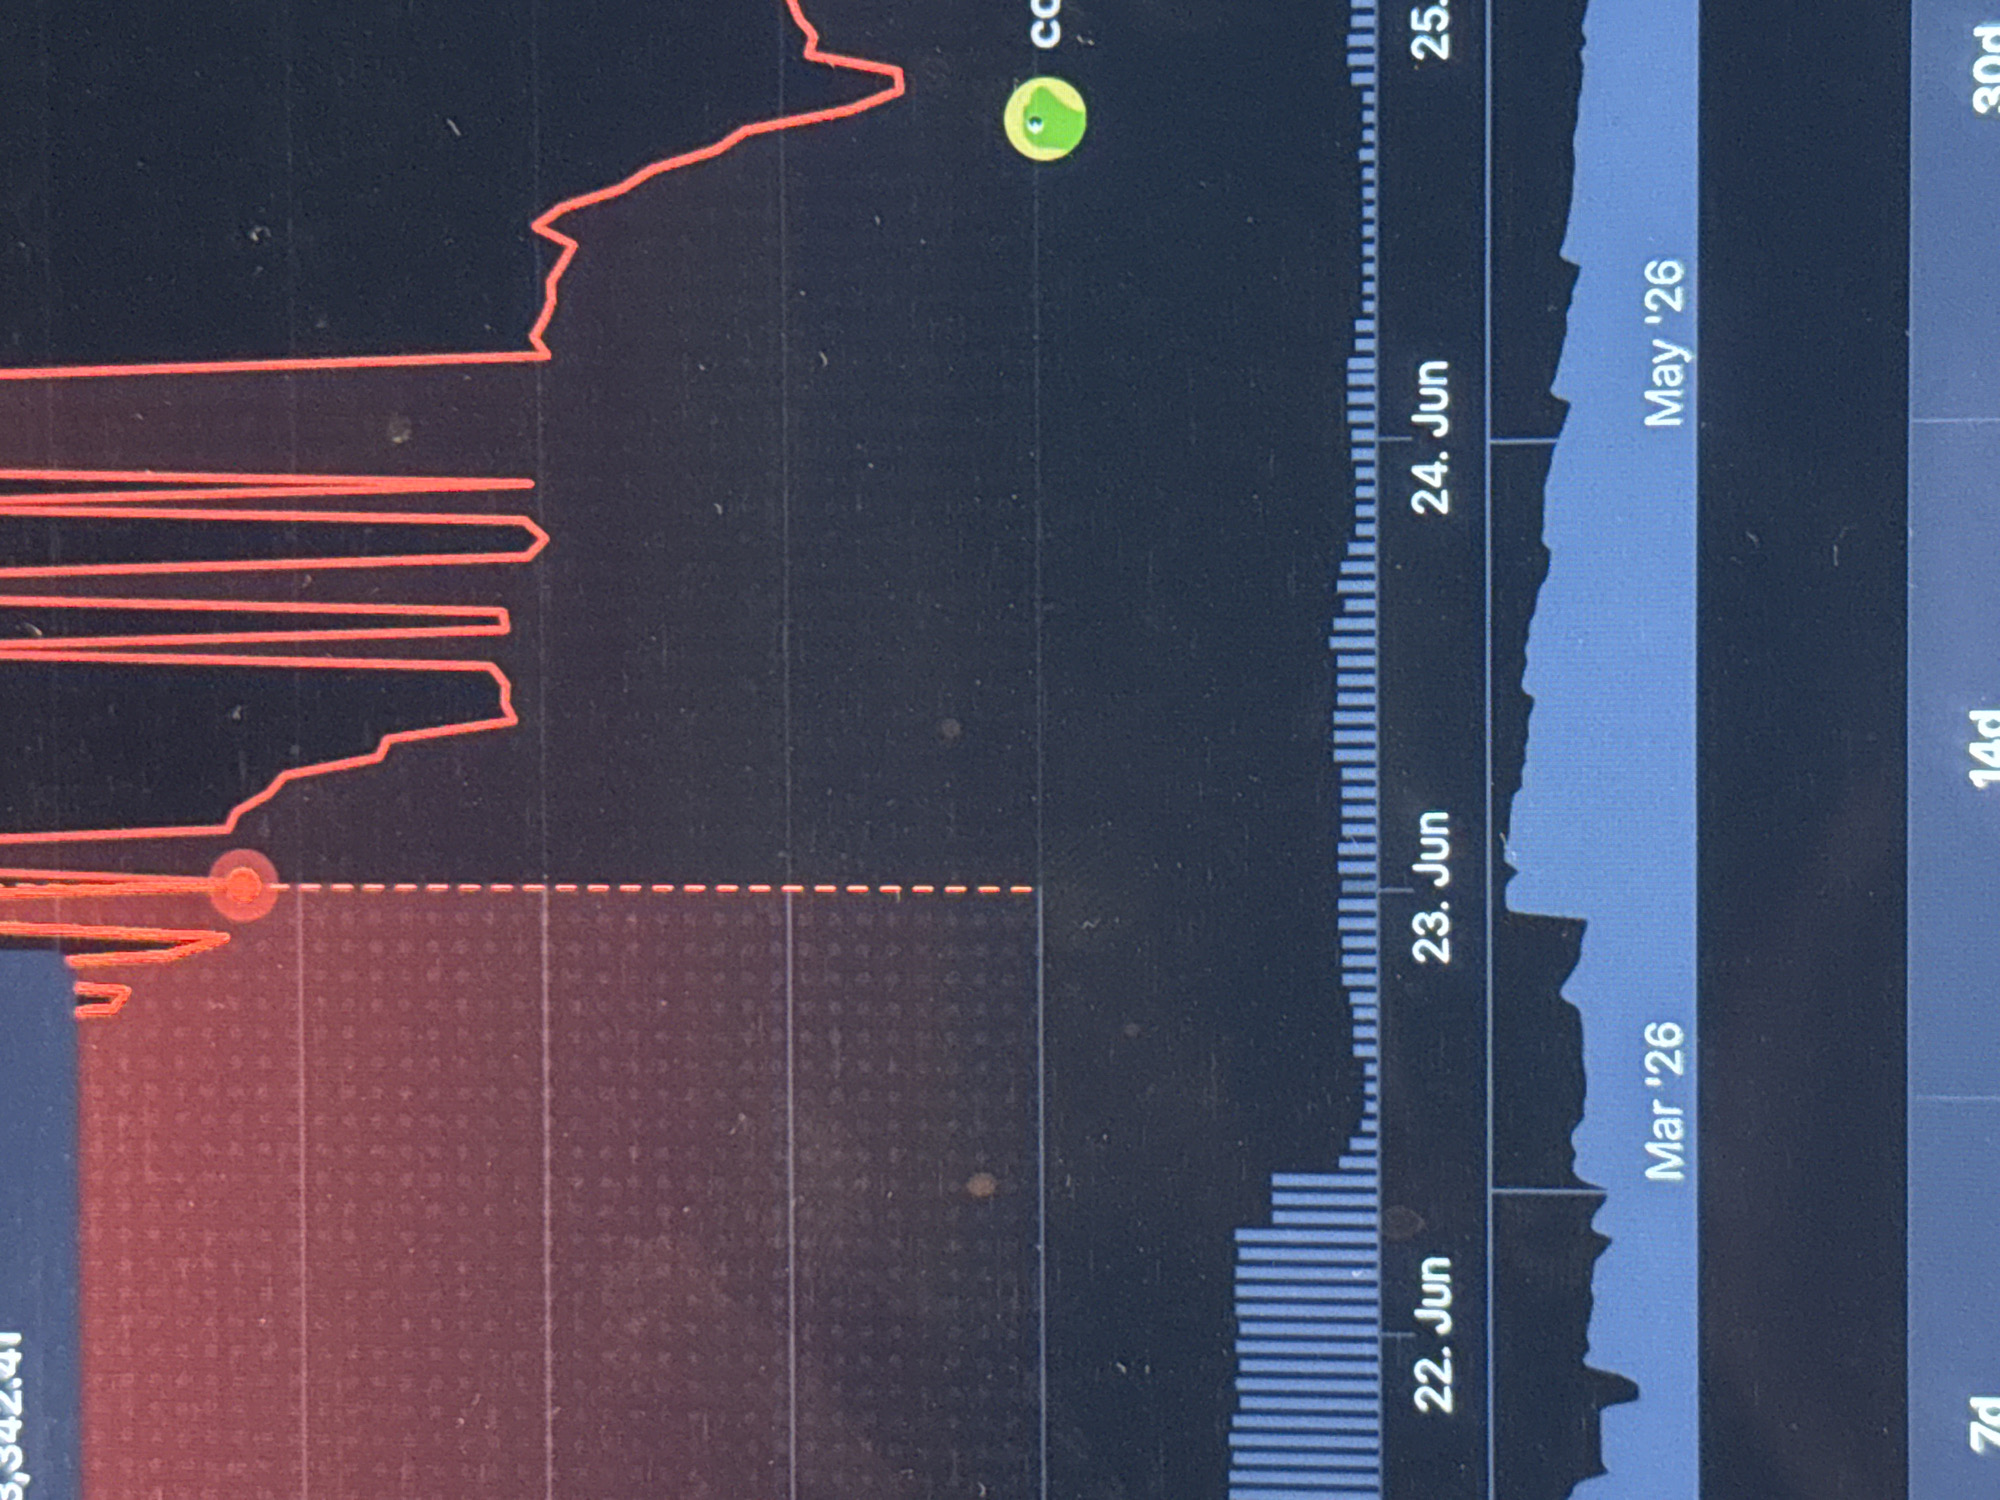
This media file is a close-up, slightly angled shot of a digital display, likely a computer monitor or tablet screen, showing a financial graph. The graph features a red line fluctuating on the left side and a blue area chart on the right. The background of the display is dark. The graph appears to track some form of financial data over time, indicated by date labels along the bottom axis. Visible date labels include "22. Jun", "23. Jun", "24. Jun", and further along, "Mar '26" and "May '26". There are also vertical markers with labels like "7d", "14d", and "30d", suggesting different time scales or reporting periods. The red line has a prominent circular marker on it. The blue area chart shows a generally downward trend, with some fluctuations. There is some text visible near the top, partially obscured, with "CC" being the most discernible part. Another partially visible word or abbreviation is also present above the red line. The overall impression is of a dynamic financial data visualization. There are no people or clear environmental cues visible, focusing solely on the screen content. The lighting suggests an indoor environment, with the screen being the primary light source.
Symbol
C84BD
Volume
11,550
Creator
+$0.04
Revenue
+$0.06
TVL
$2.99
Loading AttnAds…

2

Rev Bot 🤖💰
Injected revenue 1mo ago
“Revenue bonus for the last stake.”
+$0.06 USD