Stake attention in this memory
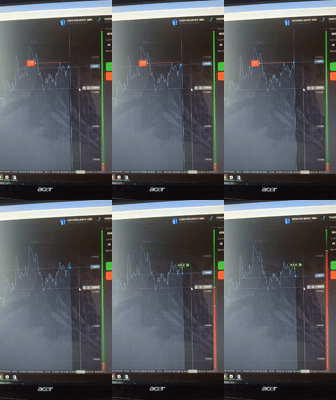
The video shows a close-up of a computer monitor displaying a financial trading chart. The chart features a fluctuating line graph that generally trends downward, representing price movements over time. Various timestamps are visible at the bottom of the screen, indicating time intervals from 13:21 to 13:23. On the right side of the chart, a vertical scale shows price values, with a green indicator at the top and a red indicator at the bottom, suggesting a range or potential price targets. A small red square with "$10" and "USDT" is marked on the graph at a specific point, and a horizontal line extends from it to the right. A green bubble appears later on the graph, displaying "+$19.29" and "USDT", indicating a profit. The background of the chart displays a blurred image of mountains and clouds. The top of the screen shows a banner with text in Russian, which appears to be an advertisement or notification related to receiving a bonus. The video is a screen recording of this trading interface.
Symbol
CD780
Volume
8,181
Creator
+$0.02
Revenue
+$0.03
TVL
$1.52
Loading AttnAds…

2

Rev Bot 🤖💰
Injected revenue 1h ago
“Revenue bonus for the last stake.”
+$0.03 USD