
Sign in
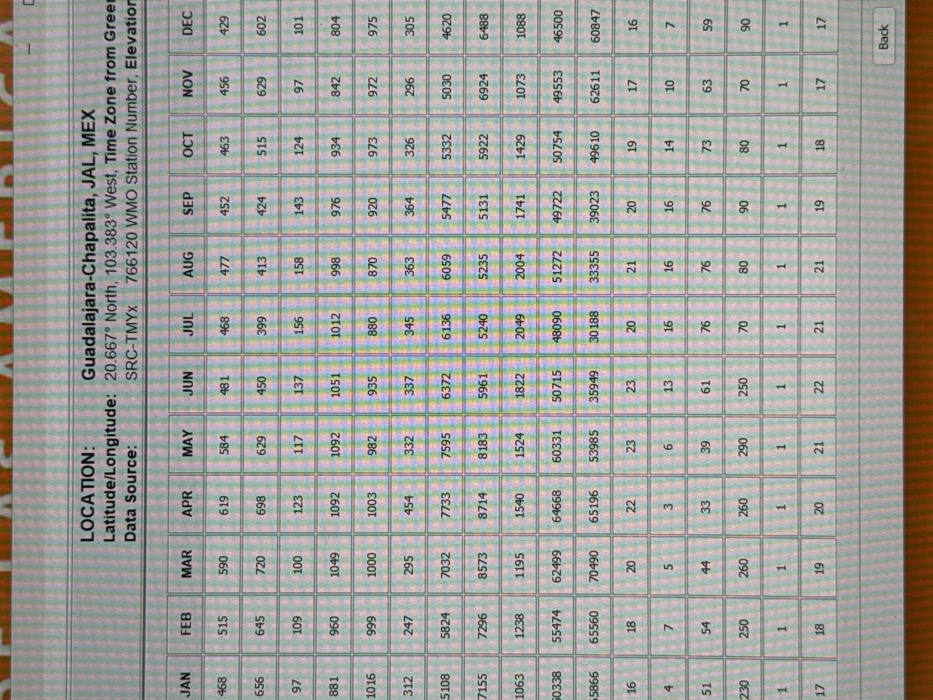
The image is a photograph of a digital screen displaying a detailed data table. The screen itself appears to be a monitor or tablet, captured at a slight angle, resulting in some glare and a soft focus, particularly noticeable on the right side and bottom. The background behind the screen is out of focus, showing indistinct brown and yellow patterns, possibly a wooden surface or fabric.

The main subject is a tabular dataset, likely meteorological or environmental, given the "WMO Station Number" and "Elevation" mentioned in the header. The table is structured with twelve columns representing the months of the year, from "JAN" (January) to "DEC" (December).

Above the monthly columns, there is header information presented in a black box with white text. It reads:
"**LOCATION:** Guadalajara-Chapalita, JAL, MEX"
"**Latitude/Longitude:** 20.667° North, 103.383° West, Time Zone from Green" (the rest of the time zone information is cut off or unreadable)
"**Data Source:** SRC-TMYX 766120 WMO Station Number, Elevation"

The table itself contains numerous rows of numerical data. Each row appears to represent a different parameter or measurement across the months.
- The first row (after the header) contains three-digit numbers ranging from 429 to 619.
- The second row also has three-digit numbers, generally in the 399 to 720 range.
- The third row displays two-to-three-digit numbers, mostly between 97 and 158.
- The fourth row consists of four-digit numbers, primarily in the 800s to 1000s.
- The fifth row continues with four-digit numbers, mostly 800s to 1000s, similar to the previous row.
- The sixth row shows three-digit numbers, mostly between 247 and 454.
- The seventh row presents four-digit numbers, ranging from approximately 4620 to 7733.
- The eighth row contains four-to-five-digit numbers, spanning from around 5131 to 8714.
- The ninth row displays four-digit numbers, mostly in the 1000s and 2000s.
- The tenth row shows five-digit numbers, ranging from approximately 46500 to 64668.
- The eleventh row also has five-digit numbers, generally from 30188 to 70490.
- The twelfth row shows two-digit numbers, mostly between 16 and 23.
- The thirteenth row contains single-digit numbers or low two-digit numbers (3-16).
- The fourteenth row has two-digit numbers, mostly in the 30s, 40s, 50s, 60s, and 70s.
- The fifteenth row displays three-digit numbers, mainly 200s and 200s, with some values around 70-90.
- The sixteenth row contains only the number "1" across all months.
- The seventeenth row shows two-digit numbers, primarily in the teens and early twenties.

In the top right corner of the screen, there is a "Back" button, rendered in white text on a dark gray oval or rectangular shape.

The overall impression is that of a data visualization or reporting interface, likely for historical climate or environmental data related to the specified location in Mexico. The numbers are consistently aligned within their cells, and the table has clear grid lines separating the data points.
nugget

Feb 10, 2026, 4:19 PM

San Andrés Cholula, Mexico

Stake attention in this memory

weather data
tabular
Guadalajara
Mexico
monthly averages

The image is a photograph of a digital screen displaying a detailed data table. The screen itself appears to be a monitor or tablet, captured at a slight angle, resulting in some glare and a soft focus, particularly noticeable on the right side and bottom. The background behind the screen is out of focus, showing indistinct brown and yellow patterns, possibly a wooden surface or fabric. The main subject is a tabular dataset, likely meteorological or environmental, given the "WMO Station Number" and "Elevation" mentioned in the header. The table is structured with twelve columns representing the months of the year, from "JAN" (January) to "DEC" (December). Above the monthly columns, there is header information presented in a black box with white text. It reads: "**LOCATION:** Guadalajara-Chapalita, JAL, MEX" "**Latitude/Longitude:** 20.667° North, 103.383° West, Time Zone from Green" (the rest of the time zone information is cut off or unreadable) "**Data Source:** SRC-TMYX 766120 WMO Station Number, Elevation" The table itself contains numerous rows of numerical data. Each row appears to represent a different parameter or measurement across the months. - The first row (after the header) contains three-digit numbers ranging from 429 to 619. - The second row also has three-digit numbers, generally in the 399 to 720 range. - The third row displays two-to-three-digit numbers, mostly between 97 and 158. - The fourth row consists of four-digit numbers, primarily in the 800s to 1000s. - The fifth row continues with four-digit numbers, mostly 800s to 1000s, similar to the previous row. - The sixth row shows three-digit numbers, mostly between 247 and 454. - The seventh row presents four-digit numbers, ranging from approximately 4620 to 7733. - The eighth row contains four-to-five-digit numbers, spanning from around 5131 to 8714. - The ninth row displays four-digit numbers, mostly in the 1000s and 2000s. - The tenth row shows five-digit numbers, ranging from approximately 46500 to 64668. - The eleventh row also has five-digit numbers, generally from 30188 to 70490. - The twelfth row shows two-digit numbers, mostly between 16 and 23. - The thirteenth row contains single-digit numbers or low two-digit numbers (3-16). - The fourteenth row has two-digit numbers, mostly in the 30s, 40s, 50s, 60s, and 70s. - The fifteenth row displays three-digit numbers, mainly 200s and 200s, with some values around 70-90. - The sixteenth row contains only the number "1" across all months. - The seventeenth row shows two-digit numbers, primarily in the teens and early twenties. In the top right corner of the screen, there is a "Back" button, rendered in white text on a dark gray oval or rectangular shape. The overall impression is that of a data visualization or reporting interface, likely for historical climate or environmental data related to the specified location in Mexico. The numbers are consistently aligned within their cells, and the table has clear grid lines separating the data points.

Loading AttnAds…

transactions
revenues
stakers
Earliest
Latest
Highest stake

No transactions found

More from this user

More from San Andrés Cholula

nugget

Feb 10, 2026, 4:19 PM

San Andrés Cholula, Mexico

Licensed under Creative Commons Attribution 4.0 International License. You are free to share and adapt this content with proper attribution.