
Stake attention in this memory
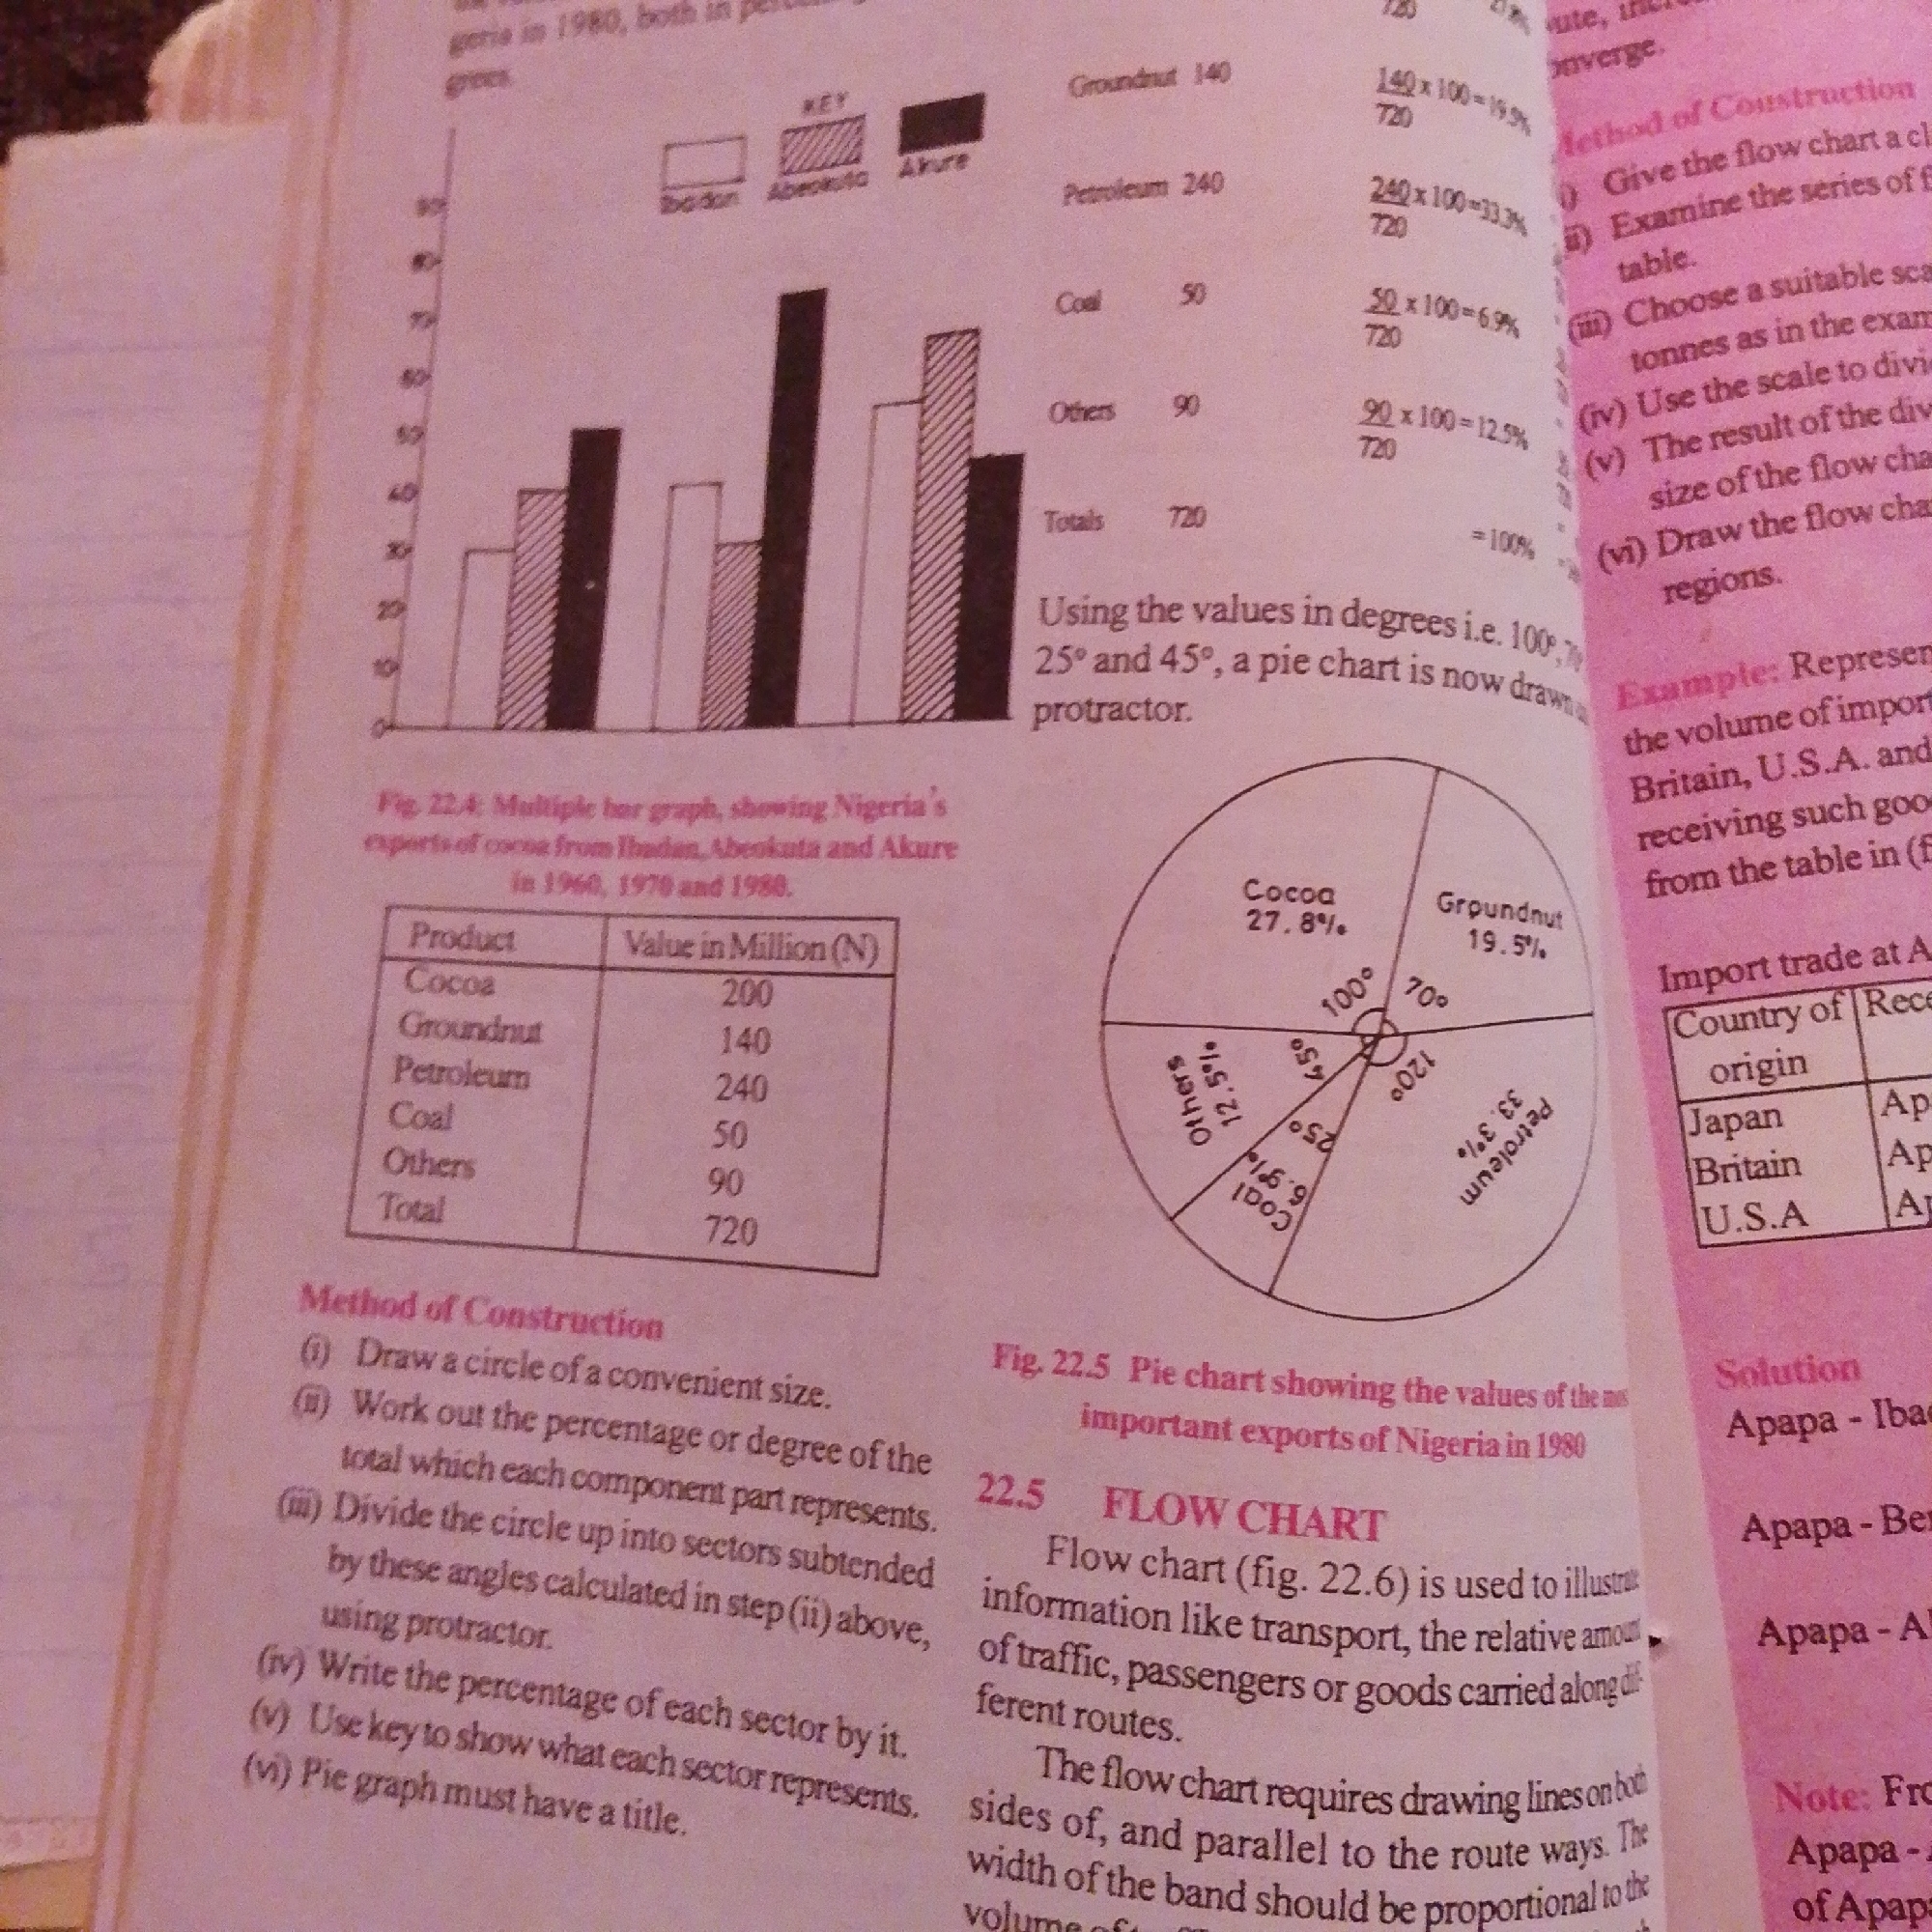
The image contains a page from a textbook or educational material. It features several graphical representations and text related to data visualization. On the left side, there is a multiple bar graph labeled "Fig. 22.4: Multiple bar graph, showing Nigeria's exports of cocoa from Ibadan, Abeokuta and Akure in 1960, 1970 and 1980." Below the graph is a table listing "Product" and "Value in Million (N)" with categories like Cocoa, Groundnut, Petroleum, Coal, Others, and Total. To the right of the bar graph, there is a pie chart labeled "Fig. 22.5 Pie chart showing the values of the most important exports of Nigeria in 1980." The pie chart is divided into sectors representing different products with their corresponding percentages and angles. Below the pie chart is a section titled "22.5 FLOW CHART". Text explains that a flow chart is used to illustrate information like transport, passengers or goods carried along different routes. Further down, on the right side of the page, there is a section titled "Method of Construction" with numbered steps on how to construct a pie chart. Below this, there is an "Example: Representing the volume of imports to Britain, U.S.A. and other countries receiving such goods from the table in (f)". A table titled "Import trade at African Countries" follows, with columns for "Country of origin" and countries like Japan, Britain, and U.S.A. The text and graphics are presented on a white or light-colored background, typical of printed educational materials. There are no people visible in the image, and the environment appears to be an indoor setting, likely a classroom or study area, given the nature of the content. There is no information about the city of Jalingo, Nigeria, in this image.
Symbol
D15D5
Volume
3,040
Creator
+$0.00
Revenue
+$0.01
TVL
$0.24
Loading AttnAds…

2

Rev Bot 🤖💰
Injected revenue 1mo ago
“Revenue bonus for the last stake.”
+$0.01 USD