Stake attention in this memory
anxiety
fear
uncertainty
volatility
caution
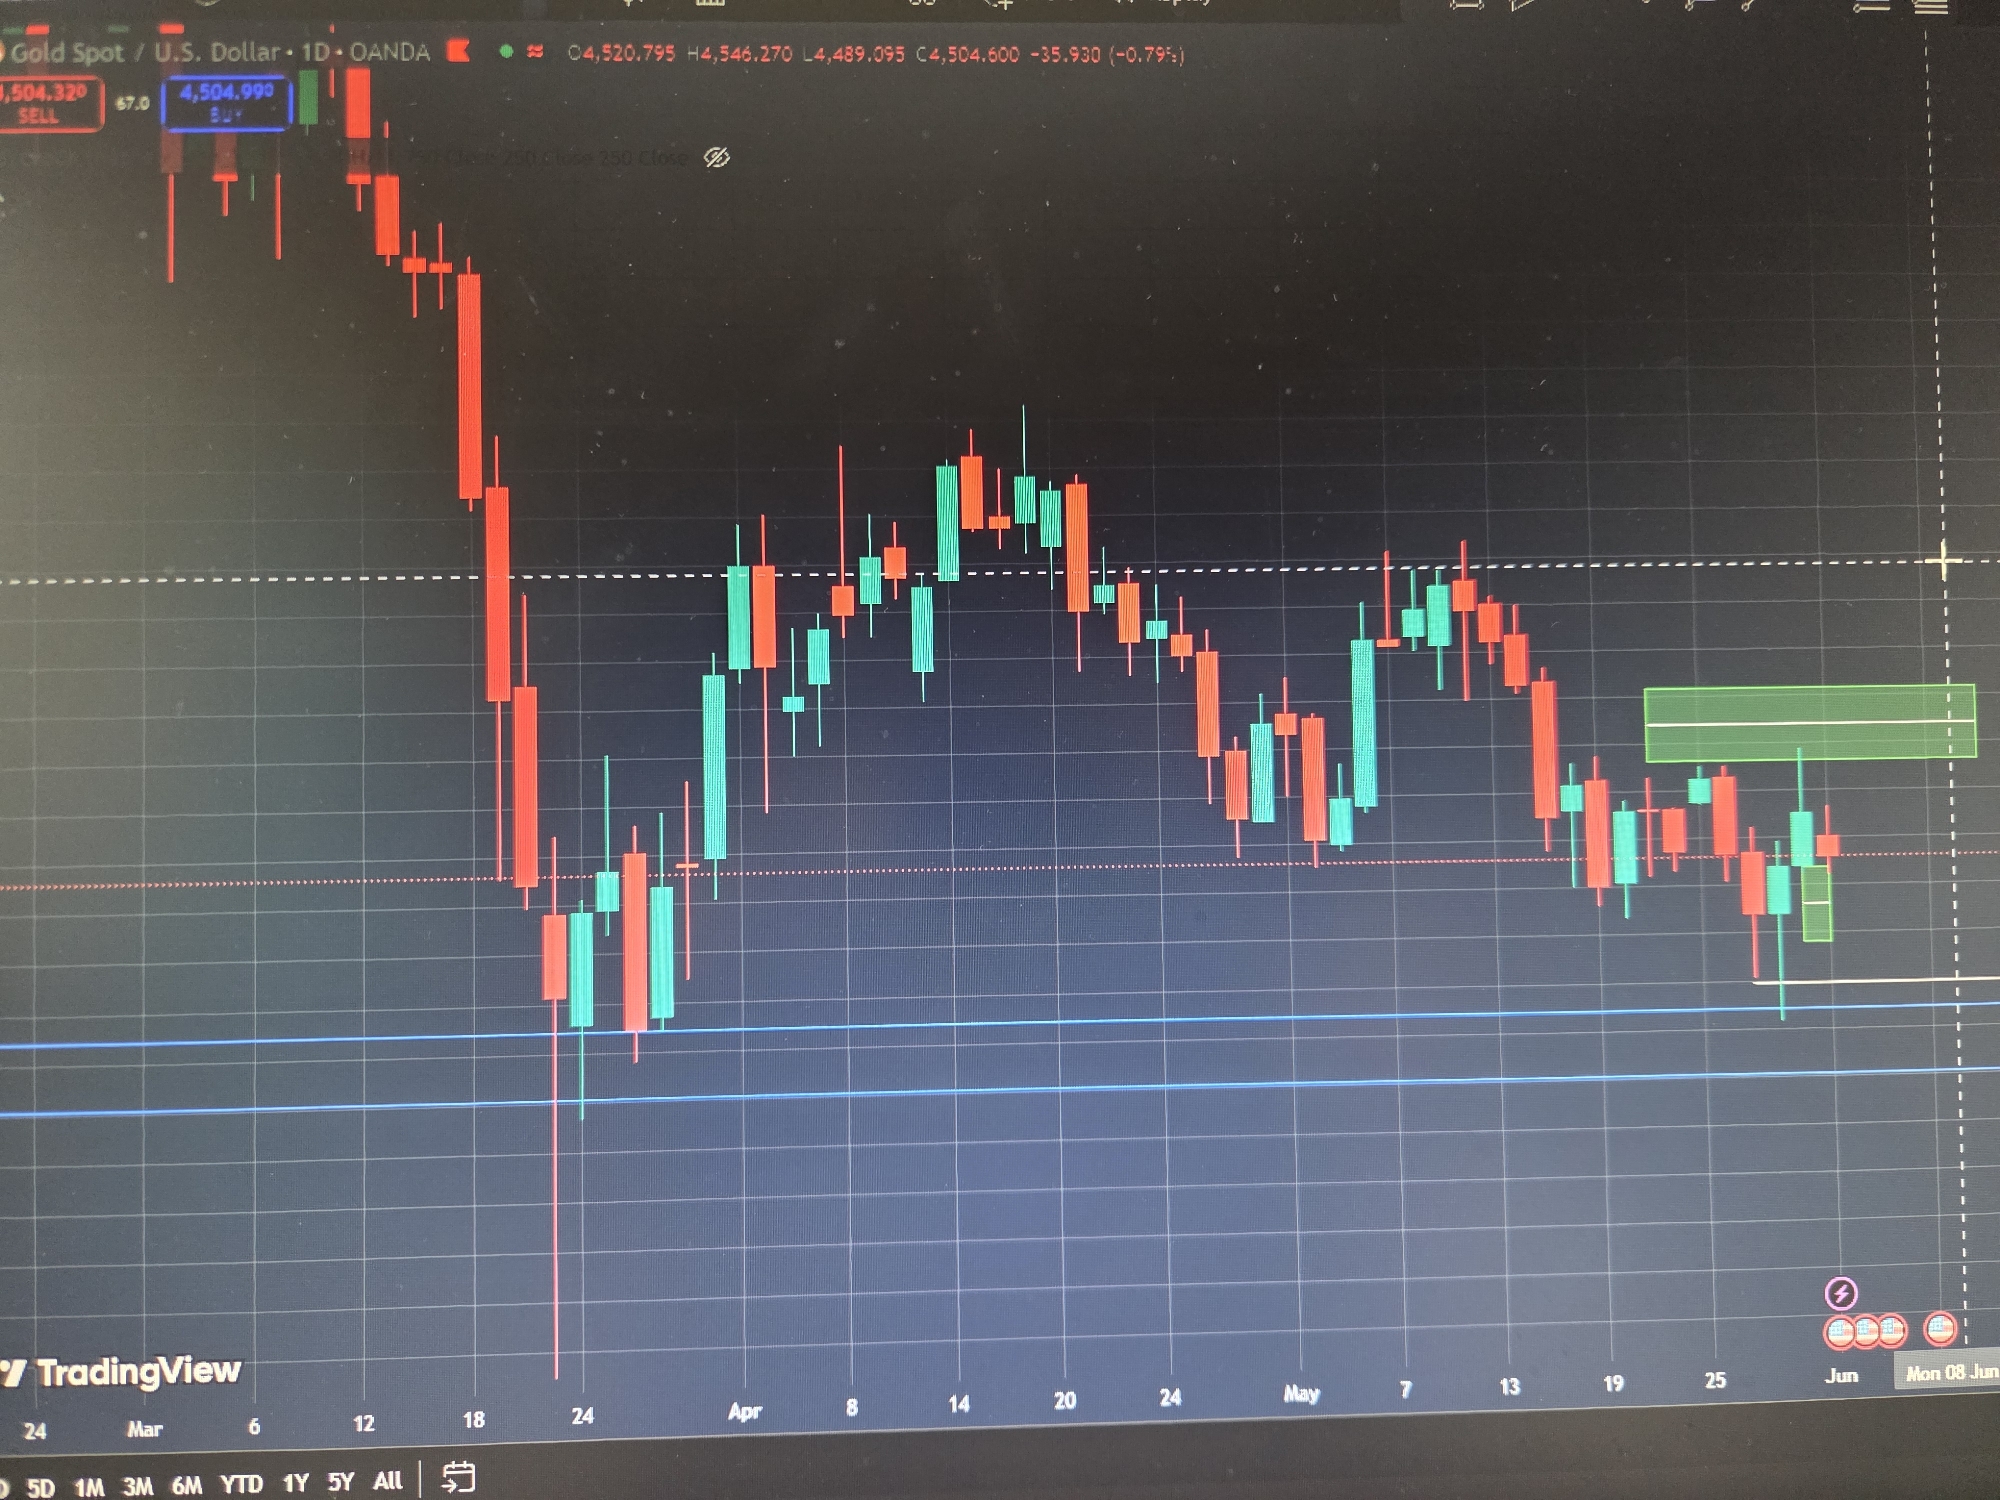
This image shows a screenshot of a TradingView chart, displaying the price of Gold Spot/U.S. Dollar (XAU/USD) on a 1-day timeframe. The chart uses candlestick patterns, where red candles represent price decreases and green candles represent price increases. The timeframe spans from late March to early June. Blue horizontal lines mark potential support or resistance levels. A green rectangle highlights a specific region on the chart, likely indicating a trading range or area of interest. The TradingView logo is visible at the bottom left. There is no indication of this image being from Stara Zagora, Bulgaria.
Symbol
D449F
Volume
1,454
Creator
+$0.00
Revenue
+$0.00
TVL
$0.23
1D
1W
1M
All
transactions
revenues
stakers
Earliest
Latest
Highest stake