Stake attention in this memory
anxious
hopeful
intense
focused
determined
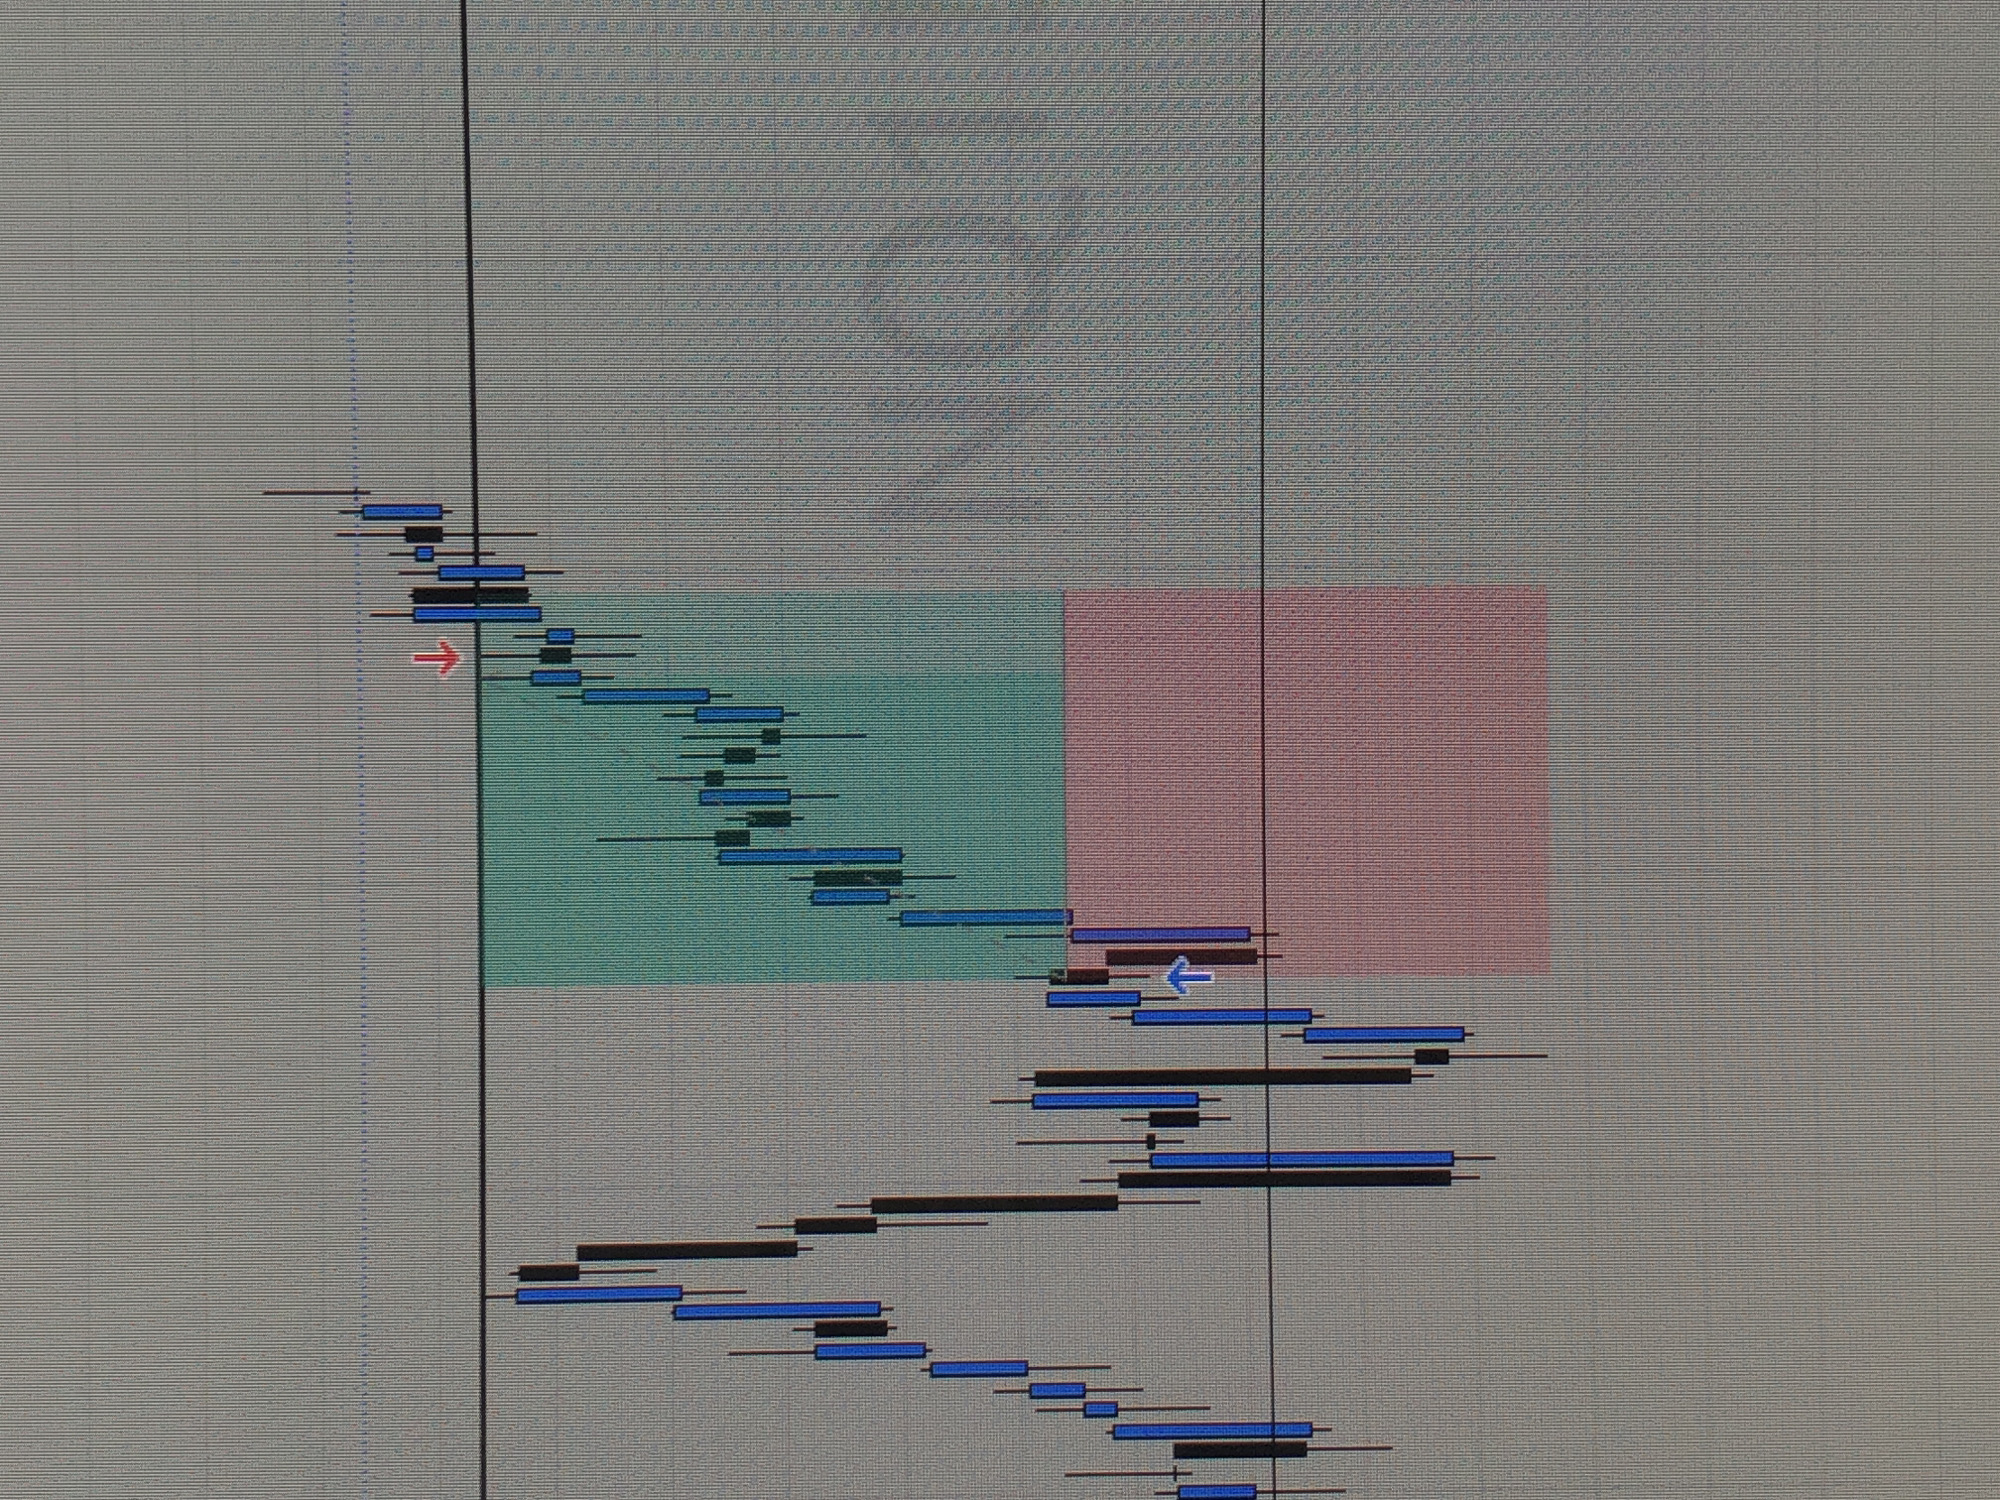
The image displays a computer screen showing a candlestick chart, a common financial chart used to illustrate price movements over time. The chart features blue and black candlesticks, which represent price fluctuations during specific periods. These candlesticks are surrounded by a green rectangle on the left and a red rectangle on the right. Red and blue arrows are superimposed on the chart. In the background, a faint logo or watermark, potentially "ON," is visible. The image lacks enough detail to connect it with a specific location in Deggendorf, Germany.
transactions
revenues
stakers
Earliest
Latest
Highest stake
No transactions found
More from this user

More from Deggendorf