Stake attention in this memory
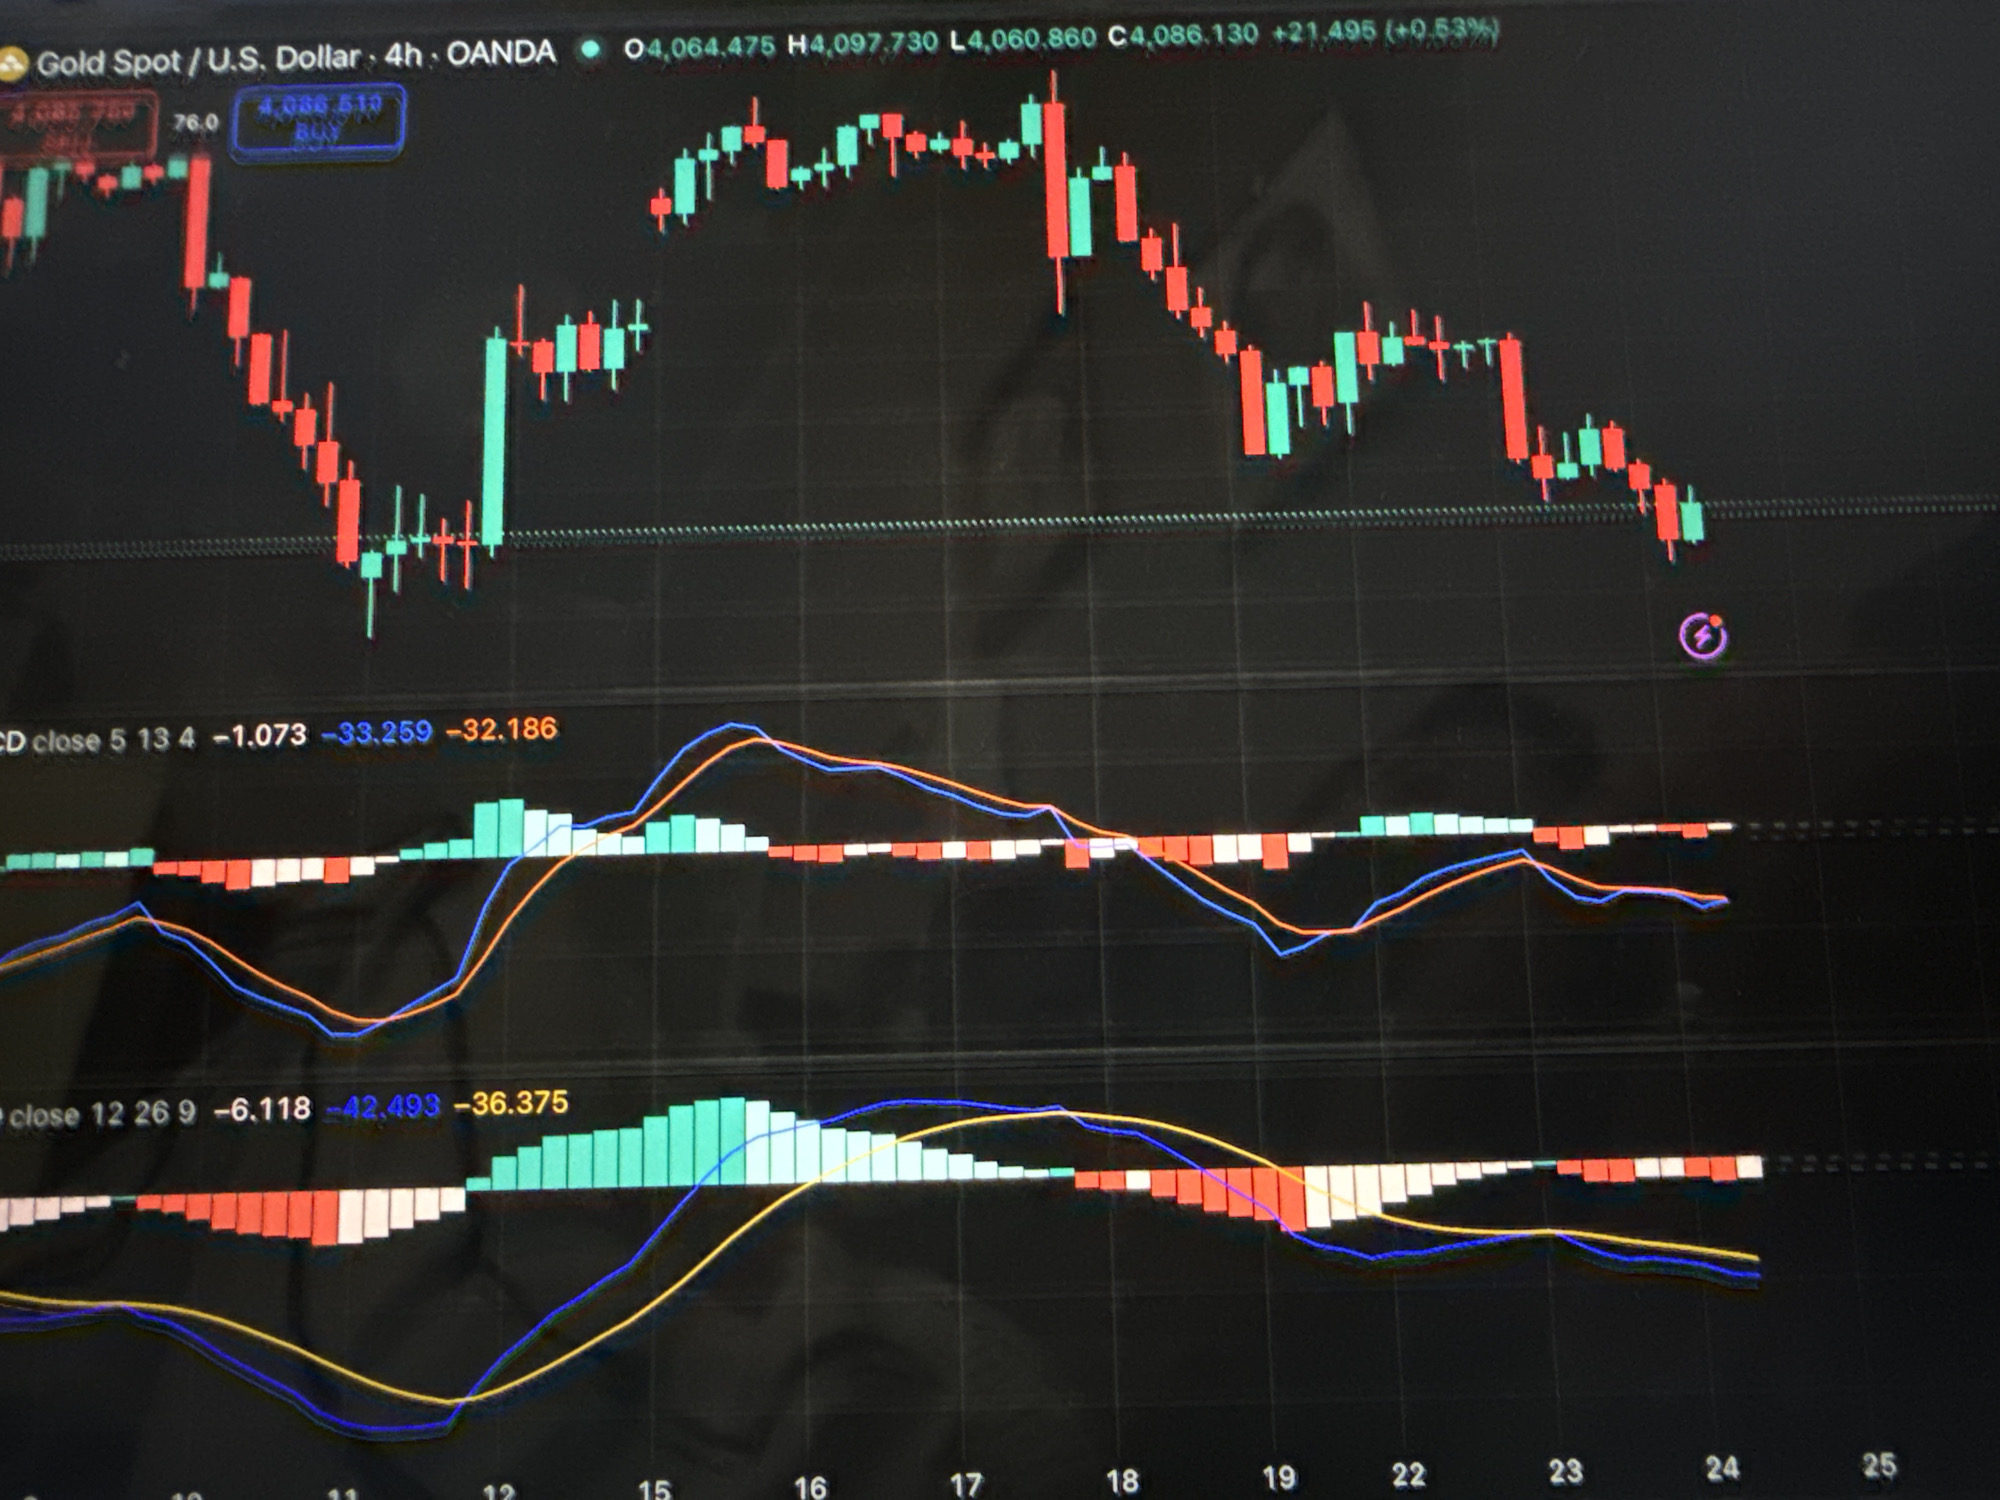
The image shows a close-up of a computer screen displaying a financial trading chart. The chart features candlestick patterns in green and red, indicating price movements over time. Below the main price chart, there are two sub-charts, likely representing technical indicators such as MACD (Moving Average Convergence Divergence). These sub-charts also contain colored bars and line graphs. Numerical data and text labels are visible at the top and along the sides of the charts, including currency pairs like "Gold Spot / U.S. Dollar" and dates or timeframes. The overall environment is dark, with the screen being the primary light source. There are no visible people, Moscow, or any other geographical context present in the image.
No transactions found