Stake attention in this memory
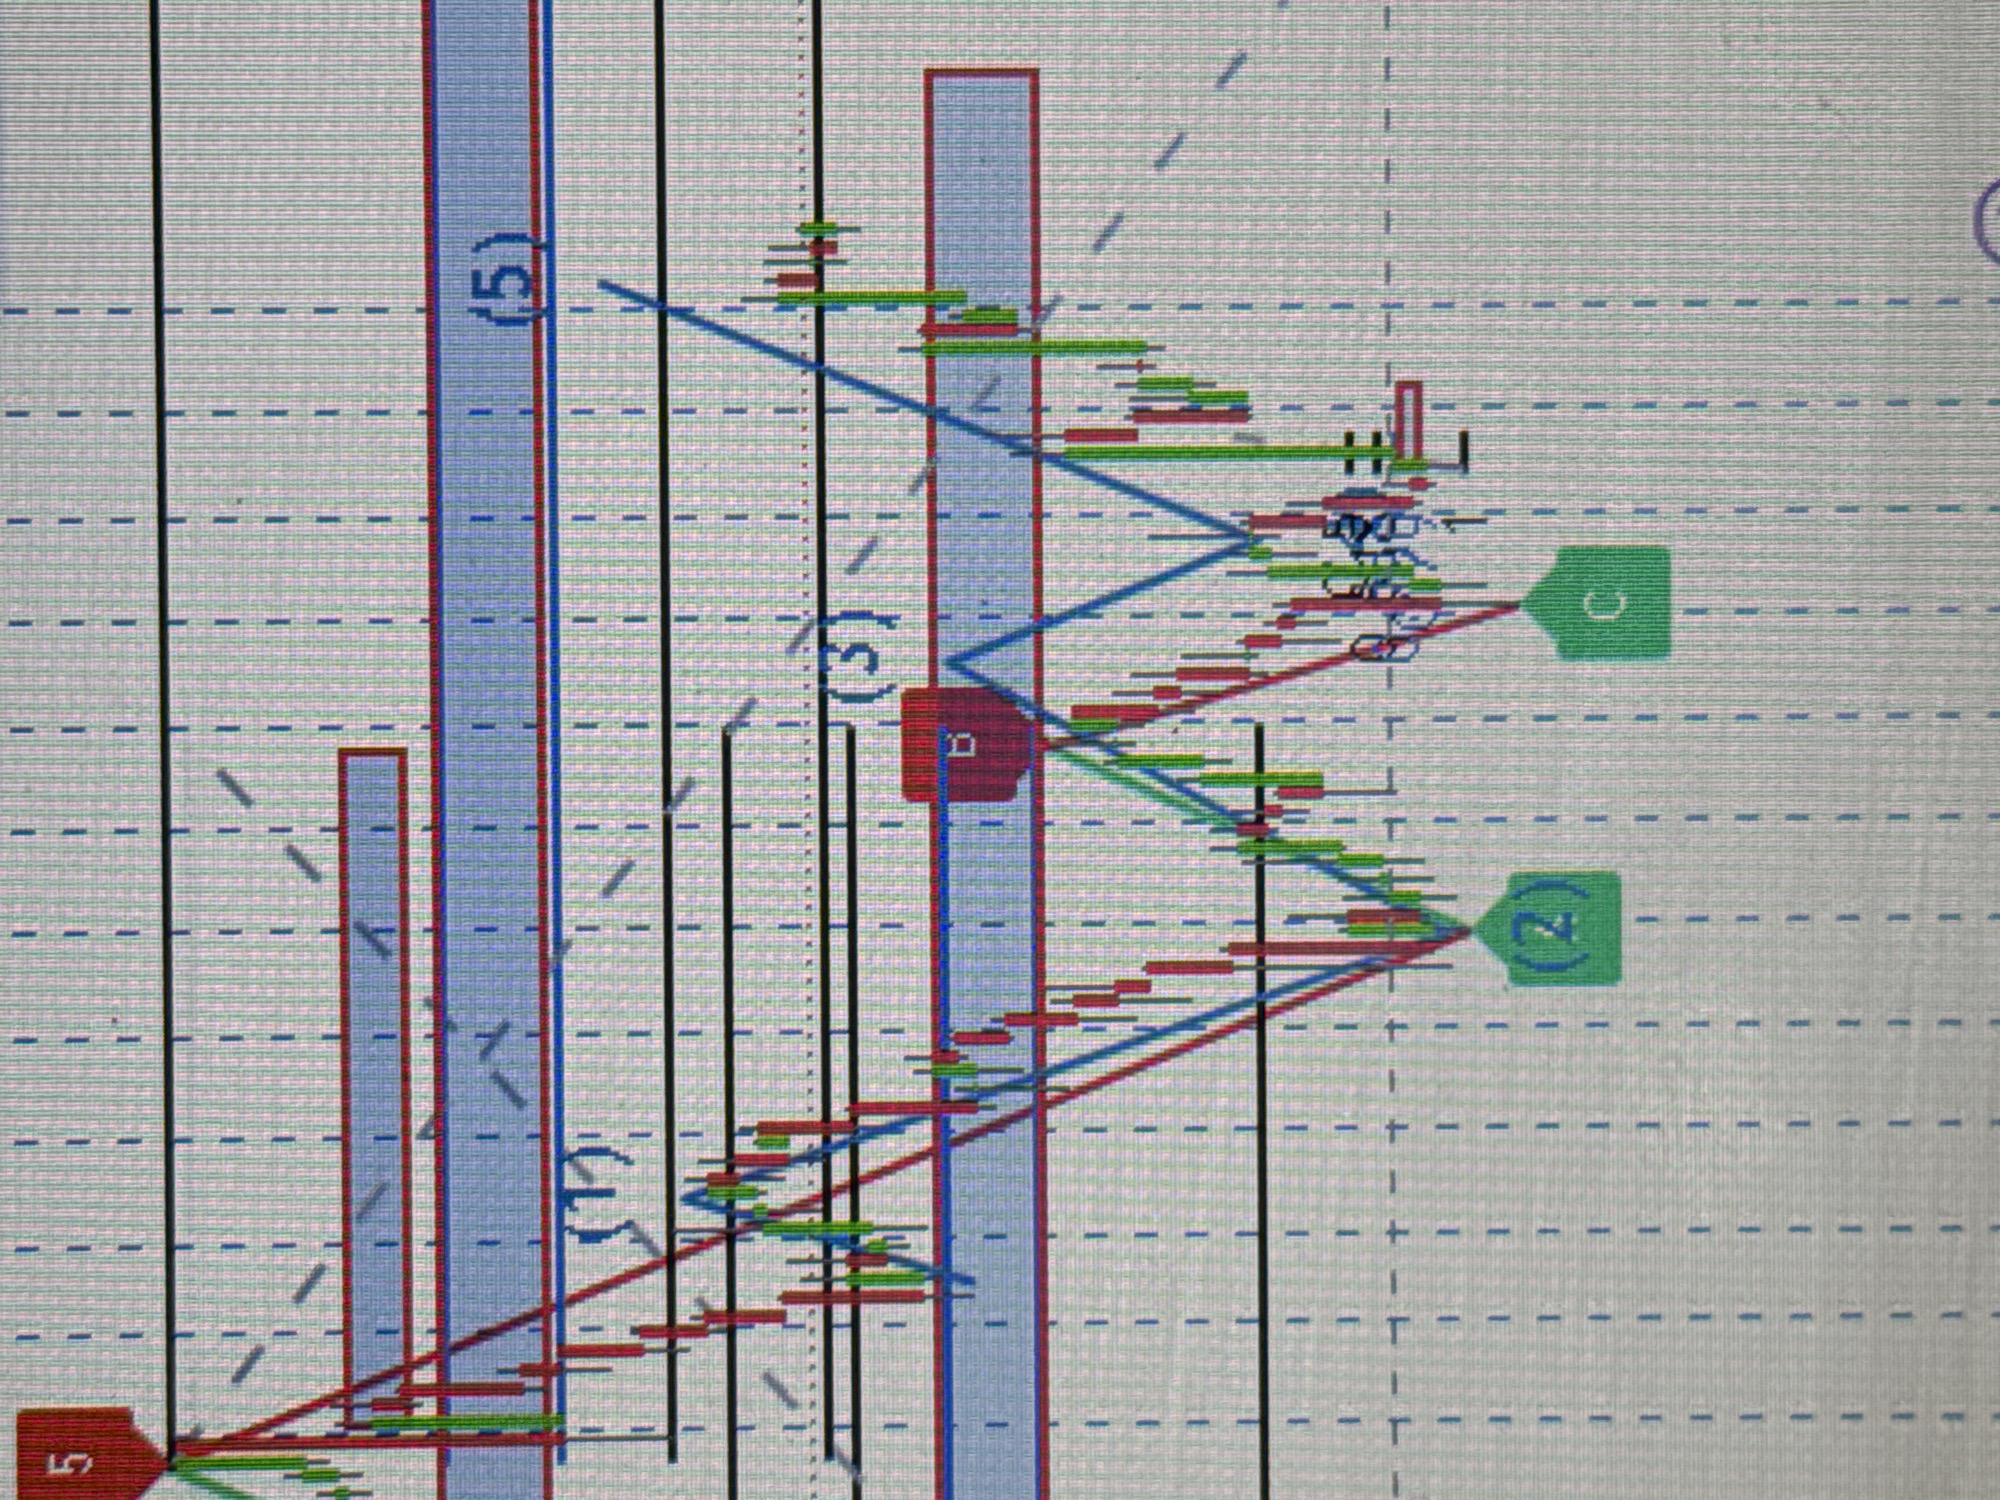
The image is a close-up, slightly blurry photograph of a financial trading chart displayed on a screen. The chart features Japanese candlesticks, primarily in red and green, indicating price movements. Overlayed on the chart are several colored lines and geometric shapes, including blue diagonal lines forming what appears to be a wave pattern, and shaded blue rectangular areas with red borders, likely representing support and resistance zones. There are also numbered labels, such as "5", "(1)", "(3)", and "(5)", and letters like "B", "C", and "E". Green markers shaped like houses with numbers or letters inside ("2" and "C") are visible near the bottom of the chart. The background is a grid of fine dashed lines. The overall scene depicts a technical analysis of financial market data.
No transactions found