
Sign in
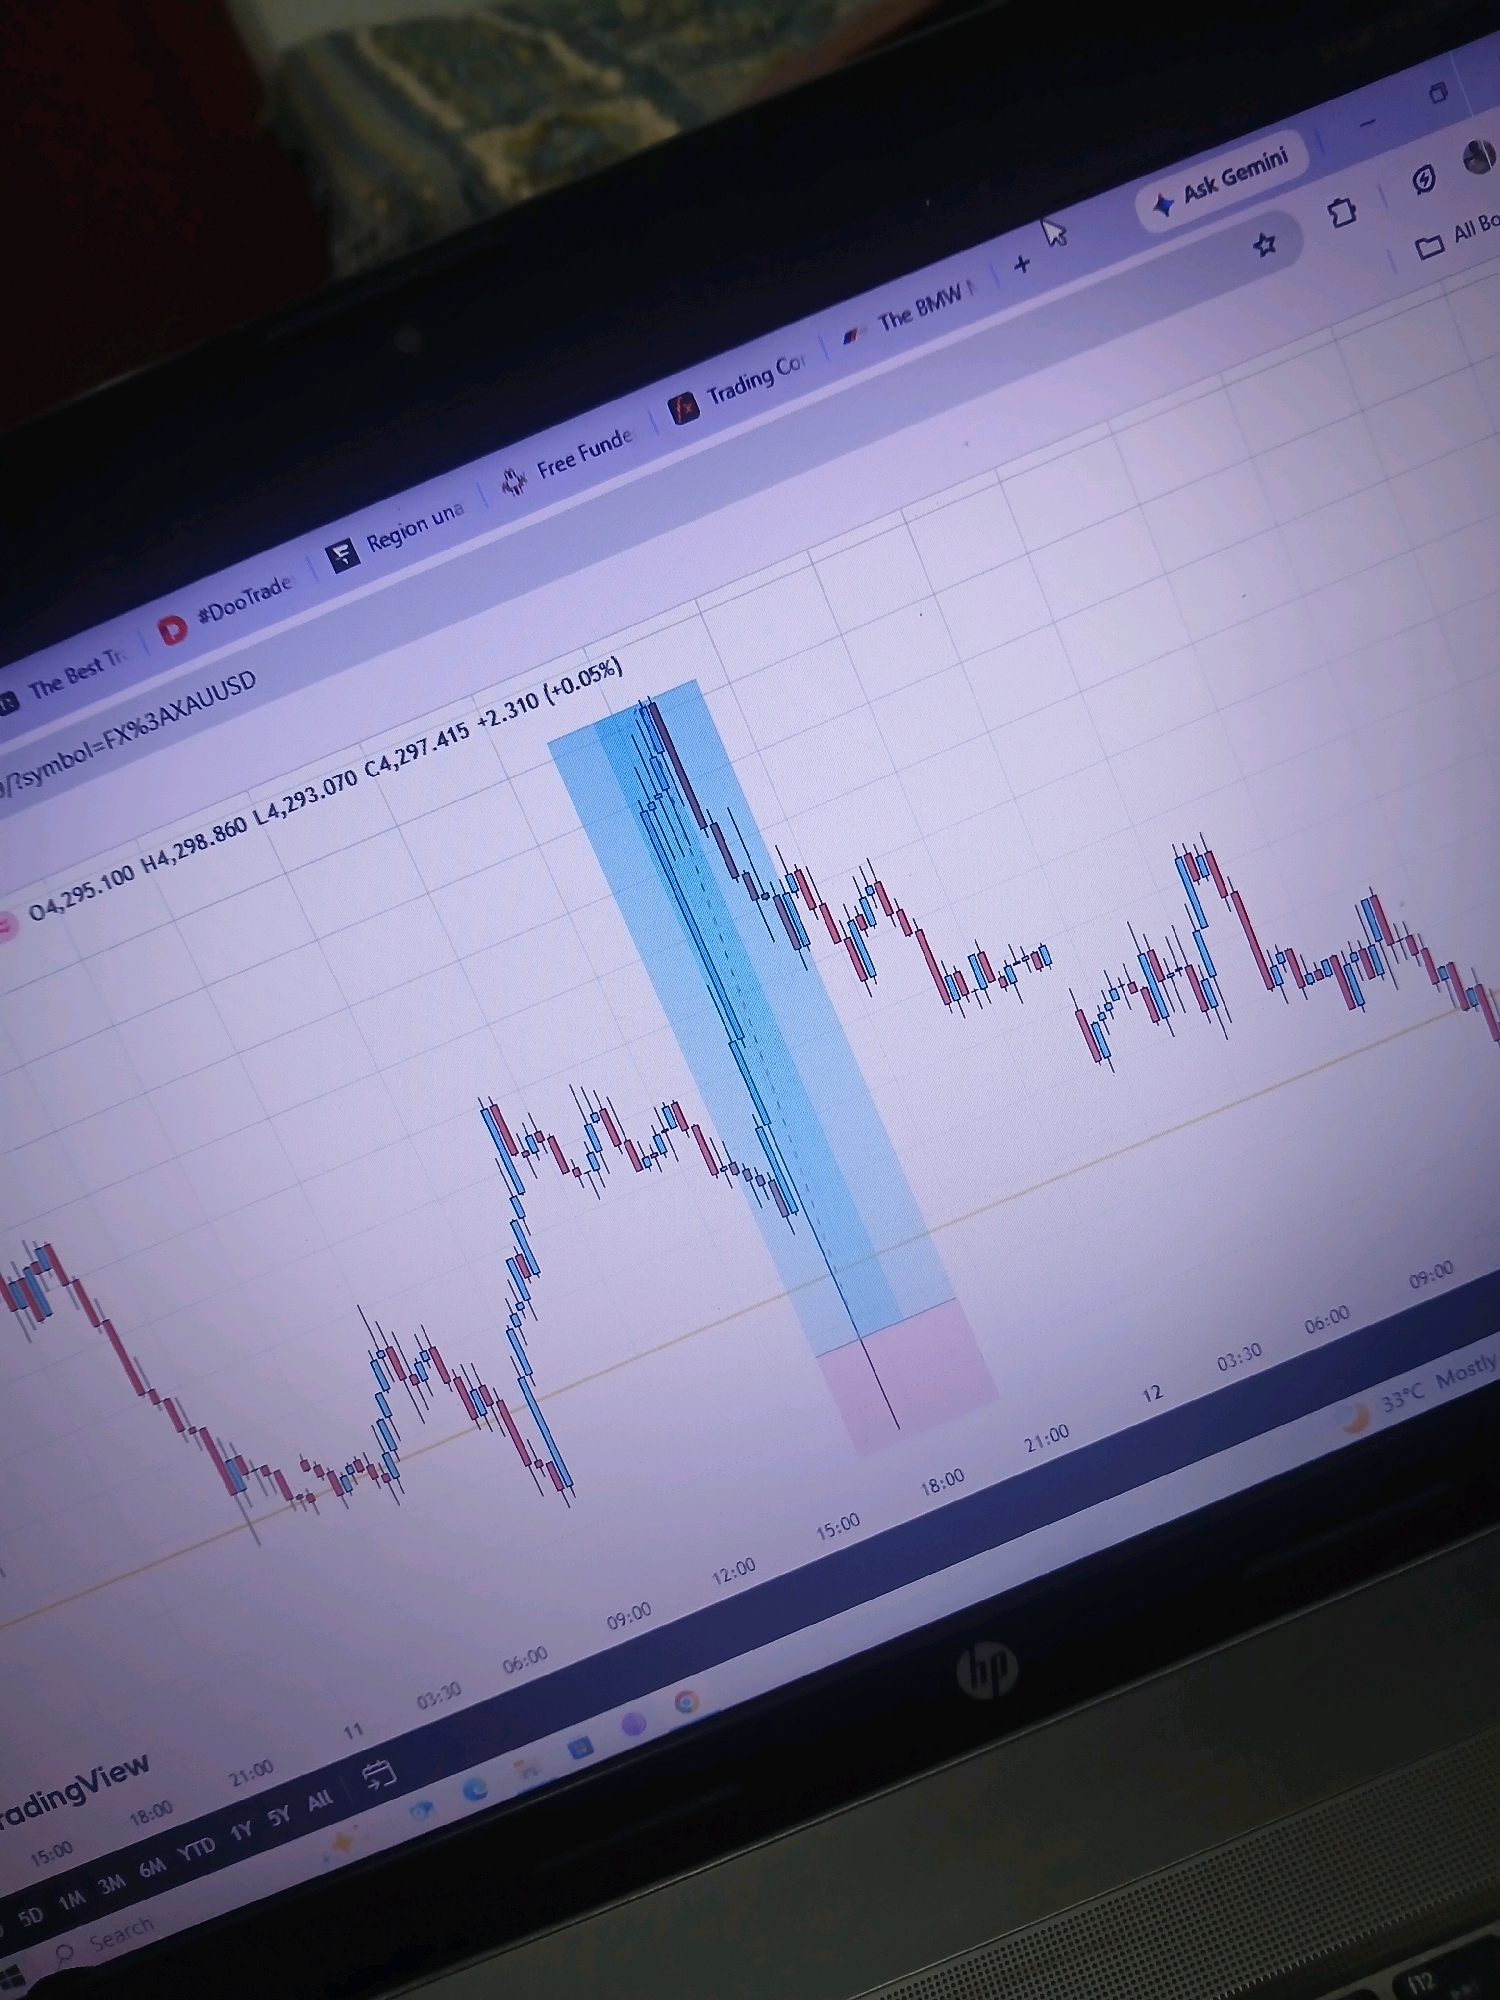
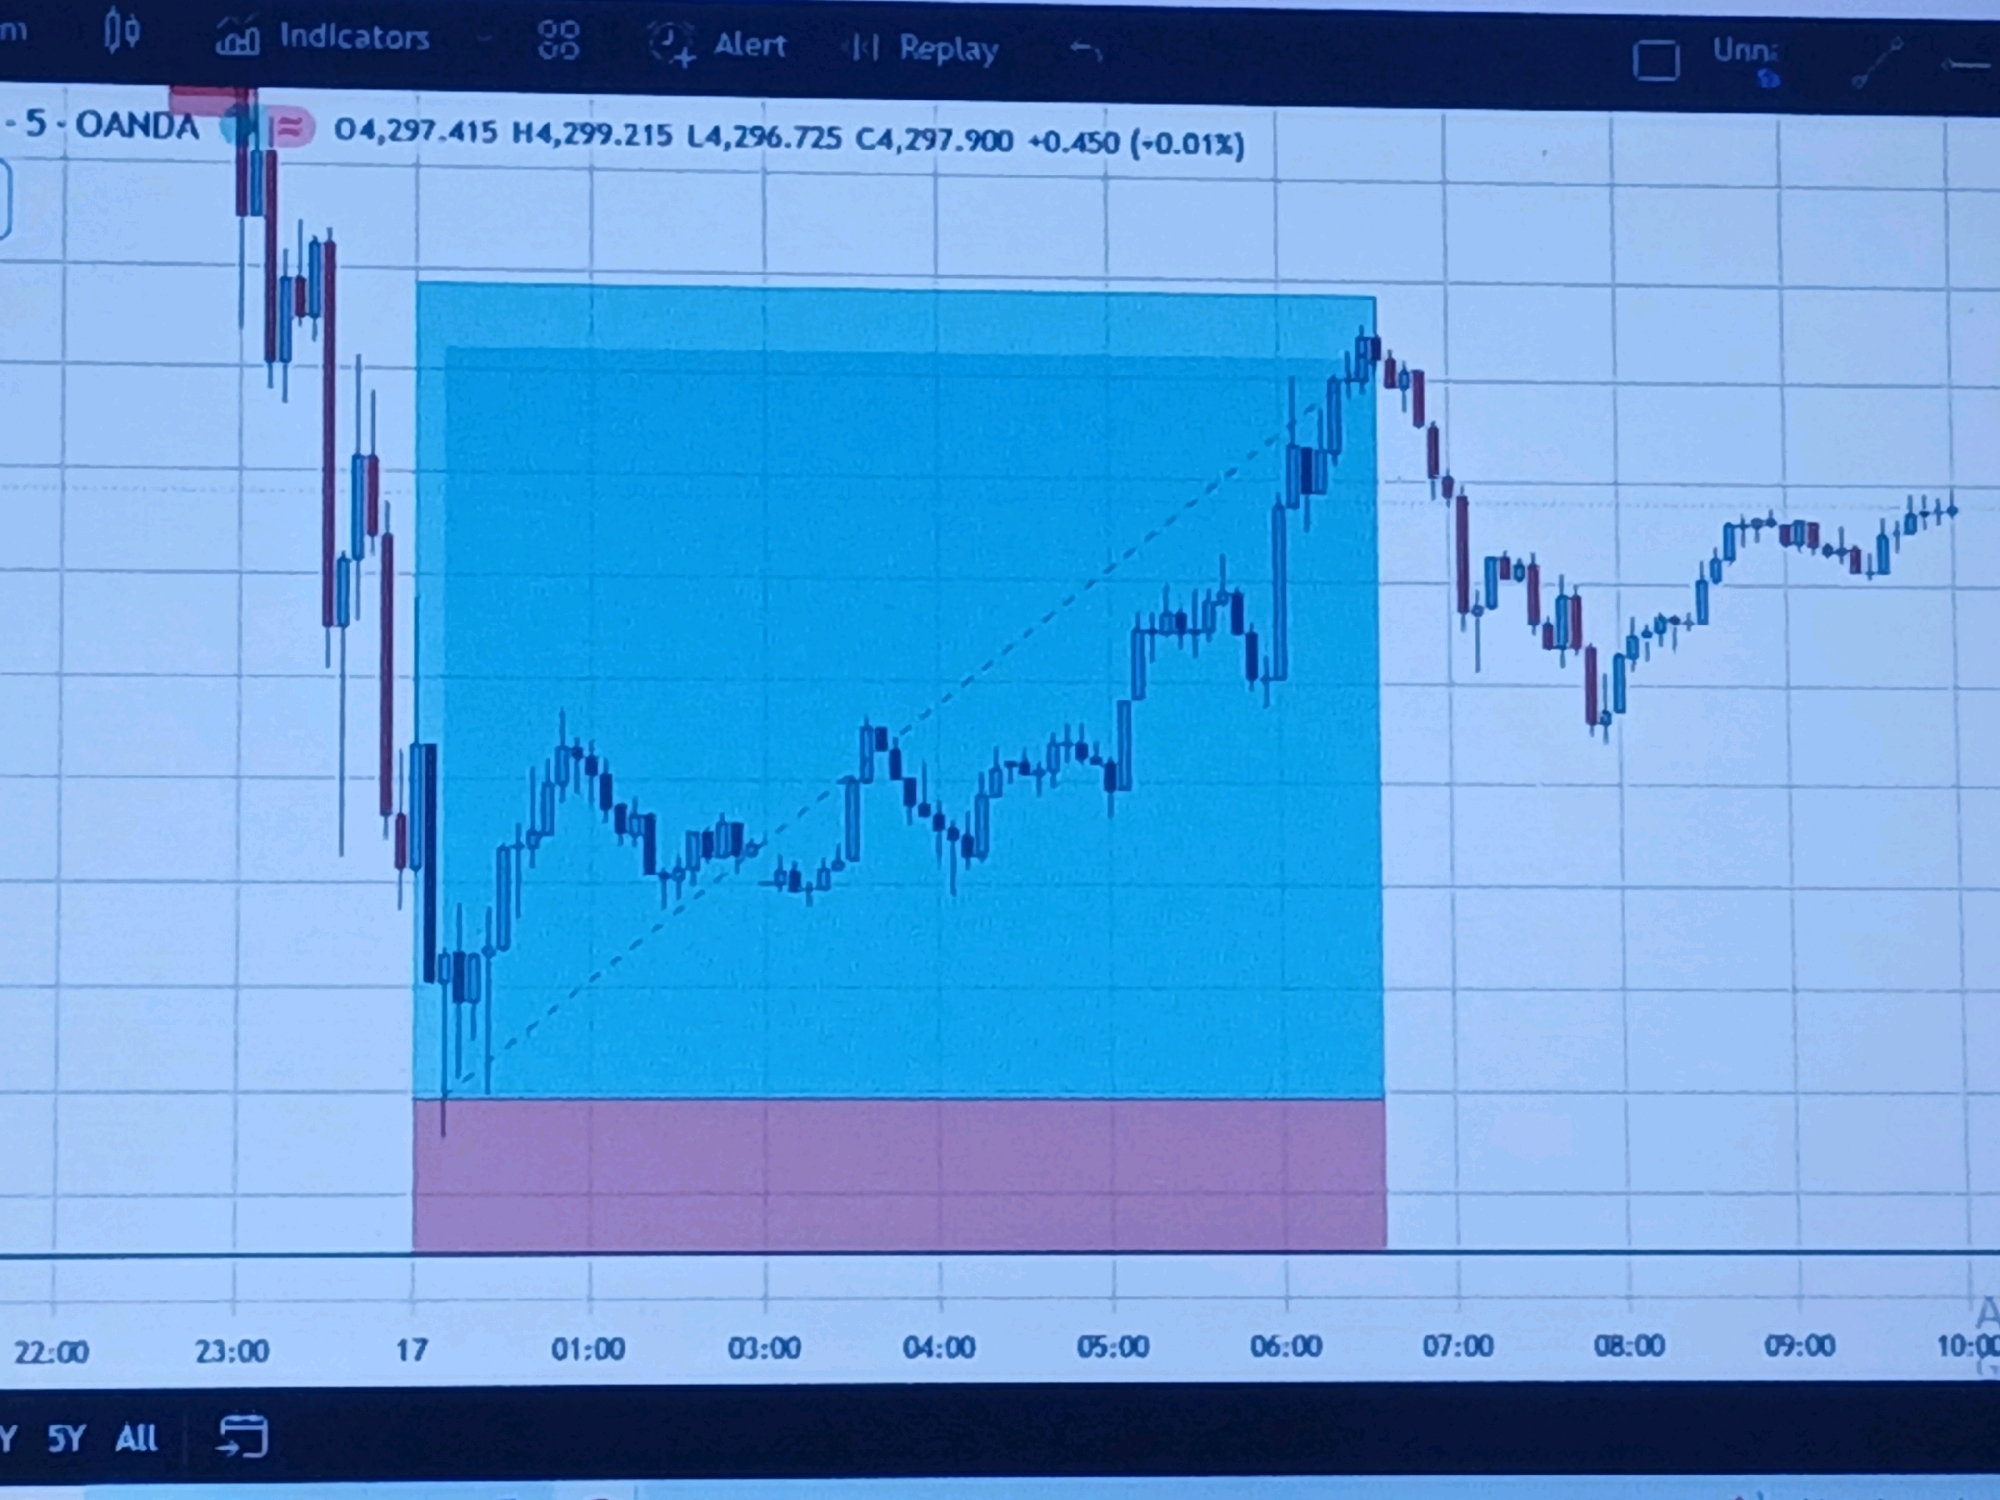
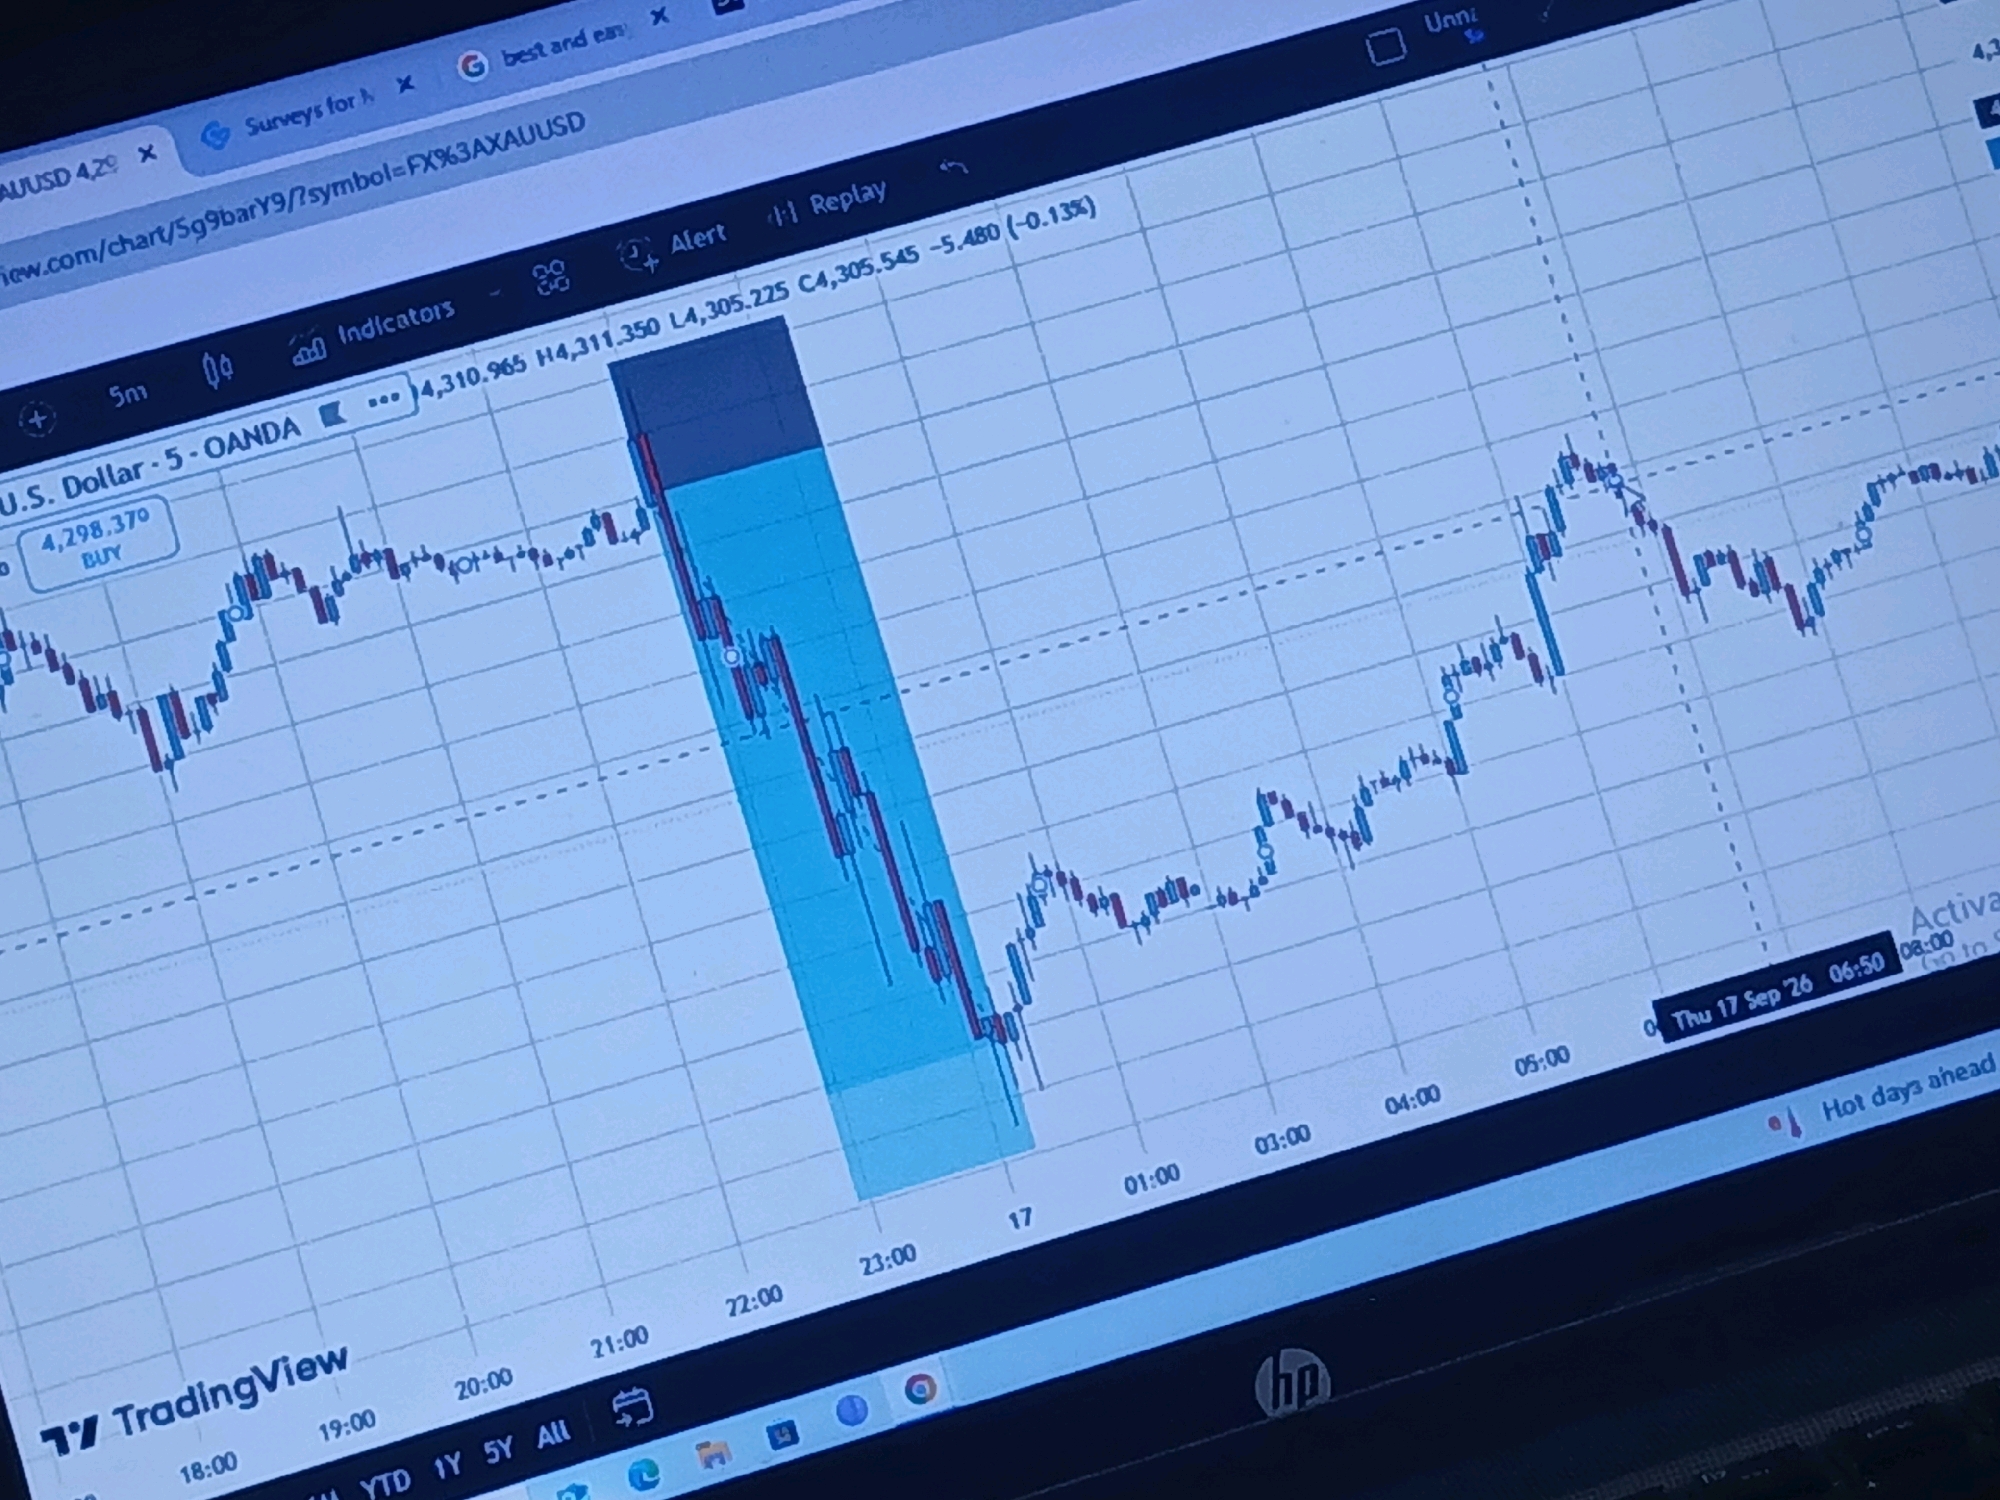
This is a close-up, eye-level, indoor shot of a computer monitor displaying a financial trading chart. The chart shows candlestick price movements over time, with a blue shaded area and a red shaded area superimposed on it. The blue area appears to represent a target or range, while the red area may indicate a stop-loss zone. The time axis at the bottom of the screen shows hours and minutes, spanning from 22:00 to 10:00. The top of the screen displays menu options like "Indicators," "Alert," and "Replay." The background is a light blue grid. There are no people or any other discernible environmental context visible.
FM-vbAiQ2

Sep 17, 2026, 5:03 AM

Unknown, Unknown

Moment

Stake attention in this memory

Anxious
Hopeful
Focused
Determined
Volatile

This is a close-up, eye-level, indoor shot of a computer monitor displaying a financial trading chart. The chart shows candlestick price movements over time, with a blue shaded area and a red shaded area superimposed on it. The blue area appears to represent a target or range, while the red area may indicate a stop-loss zone. The time axis at the bottom of the screen shows hours and minutes, spanning from 22:00 to 10:00. The top of the screen displays menu options like "Indicators," "Alert," and "Replay." The background is a light blue grid. There are no people or any other discernible environmental context visible.

Loading AttnAds…

transactions
revenues
stakers
Earliest
Latest
Highest stake

No transactions found
More from this user

More from Unknown

Nearby

this memory

nearby events

FM-vbAiQ2

Sep 17, 2026, 5:03 AM

Unknown, Unknown

Licensed under Creative Commons Attribution 4.0 International License. You are free to share and adapt this content with proper attribution.