Stake attention in this memory
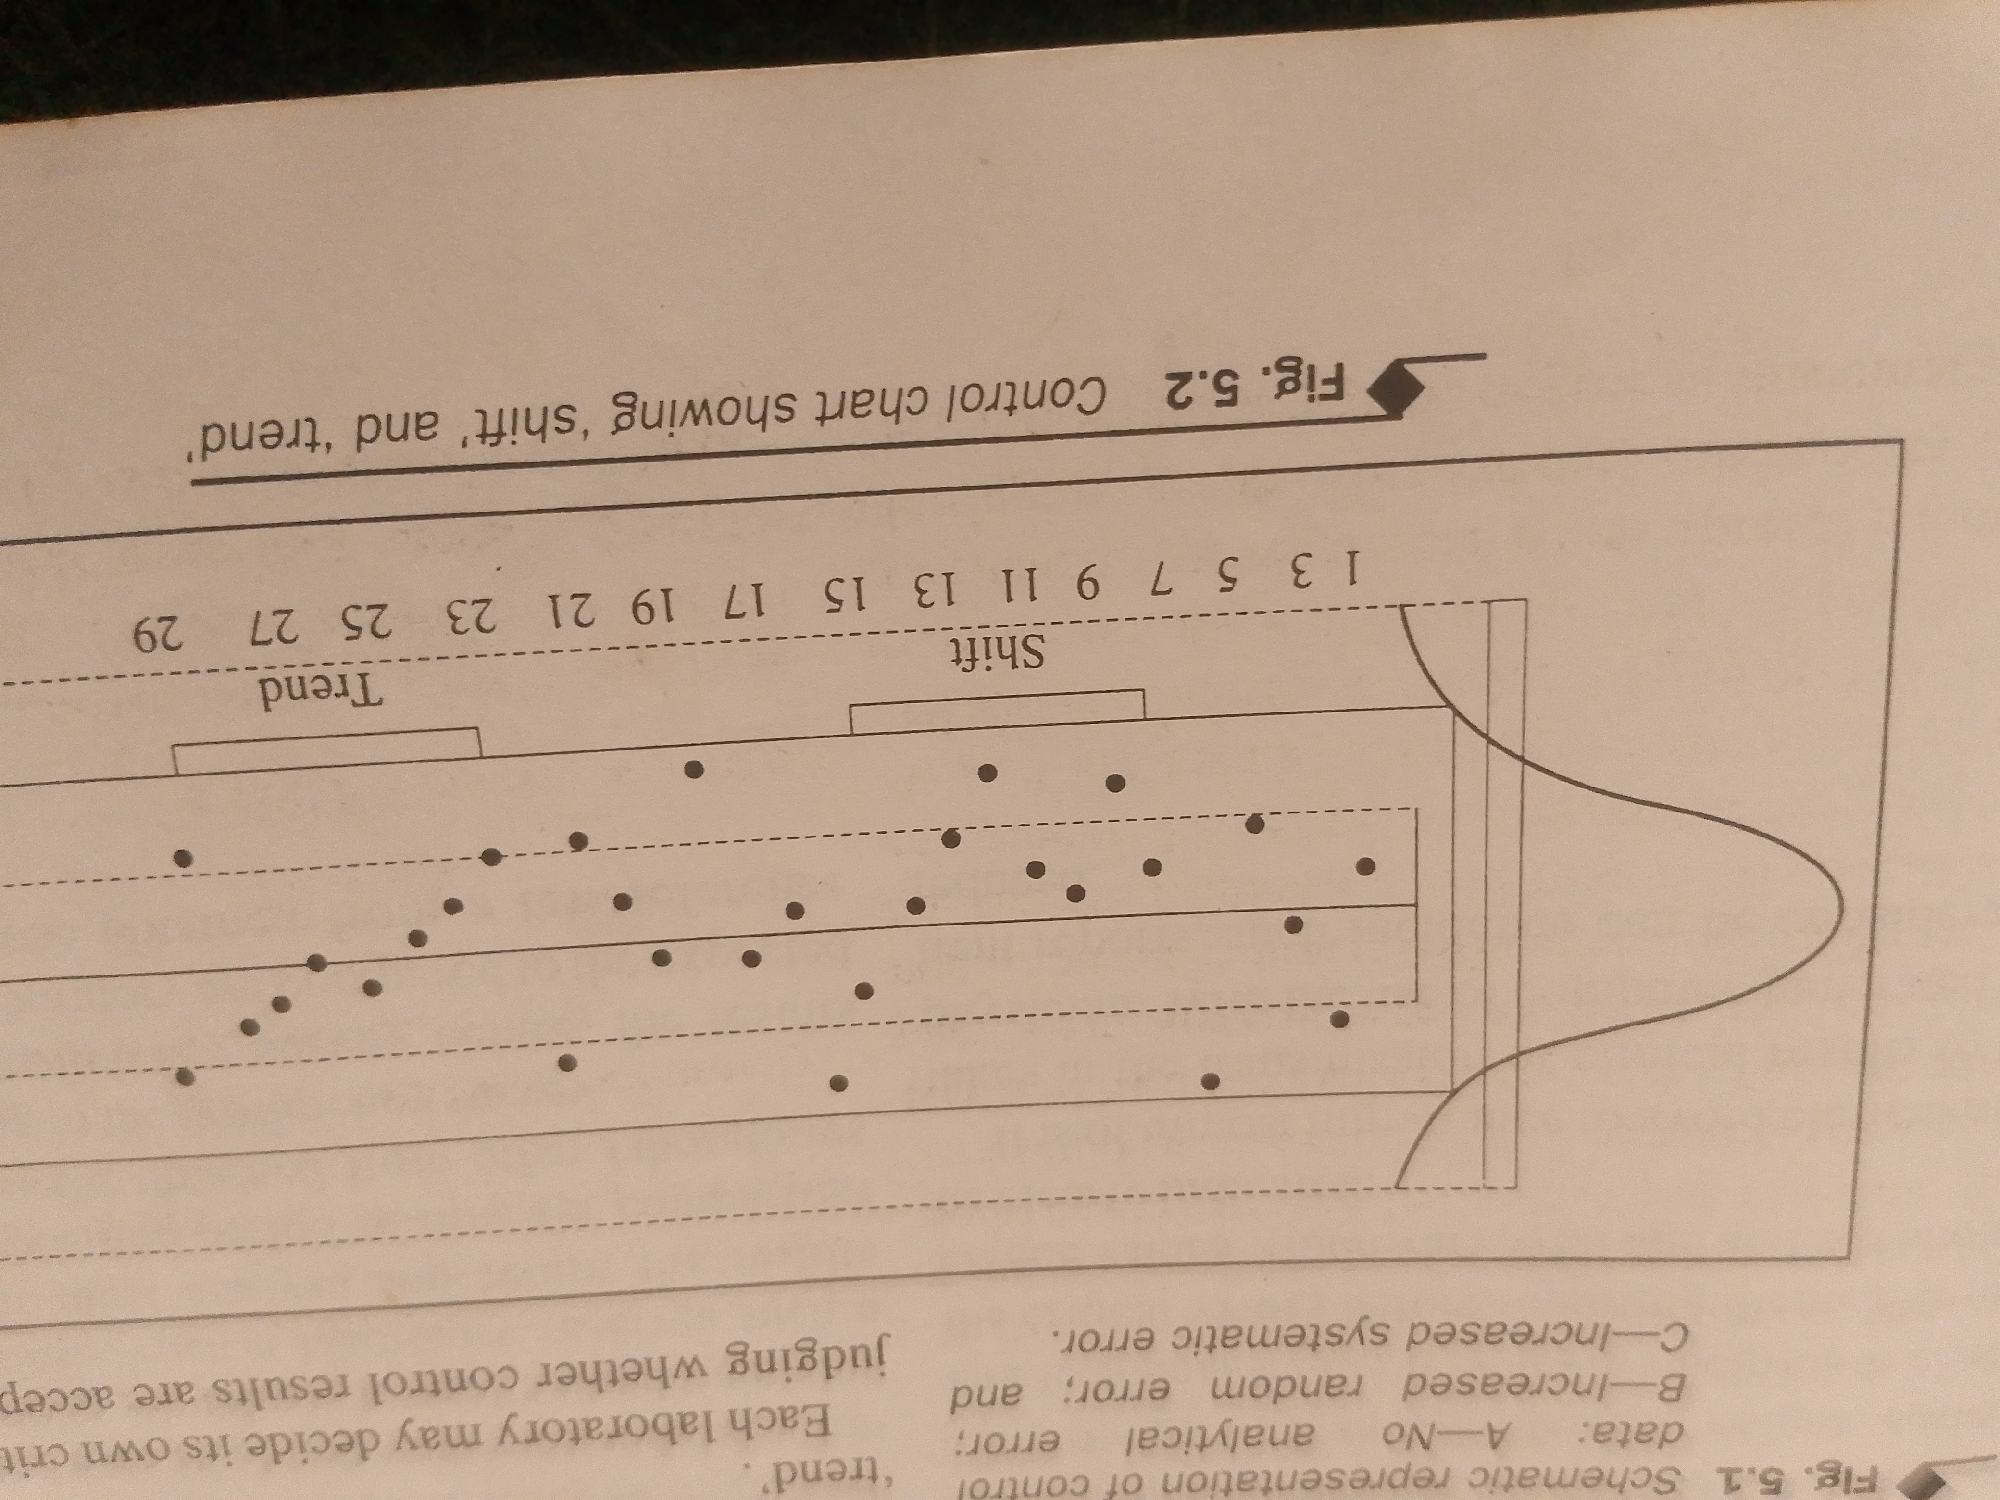
The image displays a schematic representation of a control chart, labeled as "Fig. 5.2 Control chart showing 'shift' and 'trend'." The chart features a series of data points plotted over time, indicated by numbers along the horizontal axis from 1 to 29. There are horizontal dashed lines representing control limits. A curved line on the right side of the chart suggests a normal distribution, possibly a target or expected outcome. Text below the chart describes different types of errors: "A-No data", "B-Increased random error", and "C-Increased systematic error". Another line of text indicates that "Each laboratory may decide its own criteria for judging whether control results are acceptable." The image also includes vertical boxes labeled "Shift" and "Trend" above the data points, indicating potential deviations. The image is a diagram and does not depict a real-world scene in Jalingo, Nigeria, or any other specific location.
No transactions found