
Stake attention in this memory
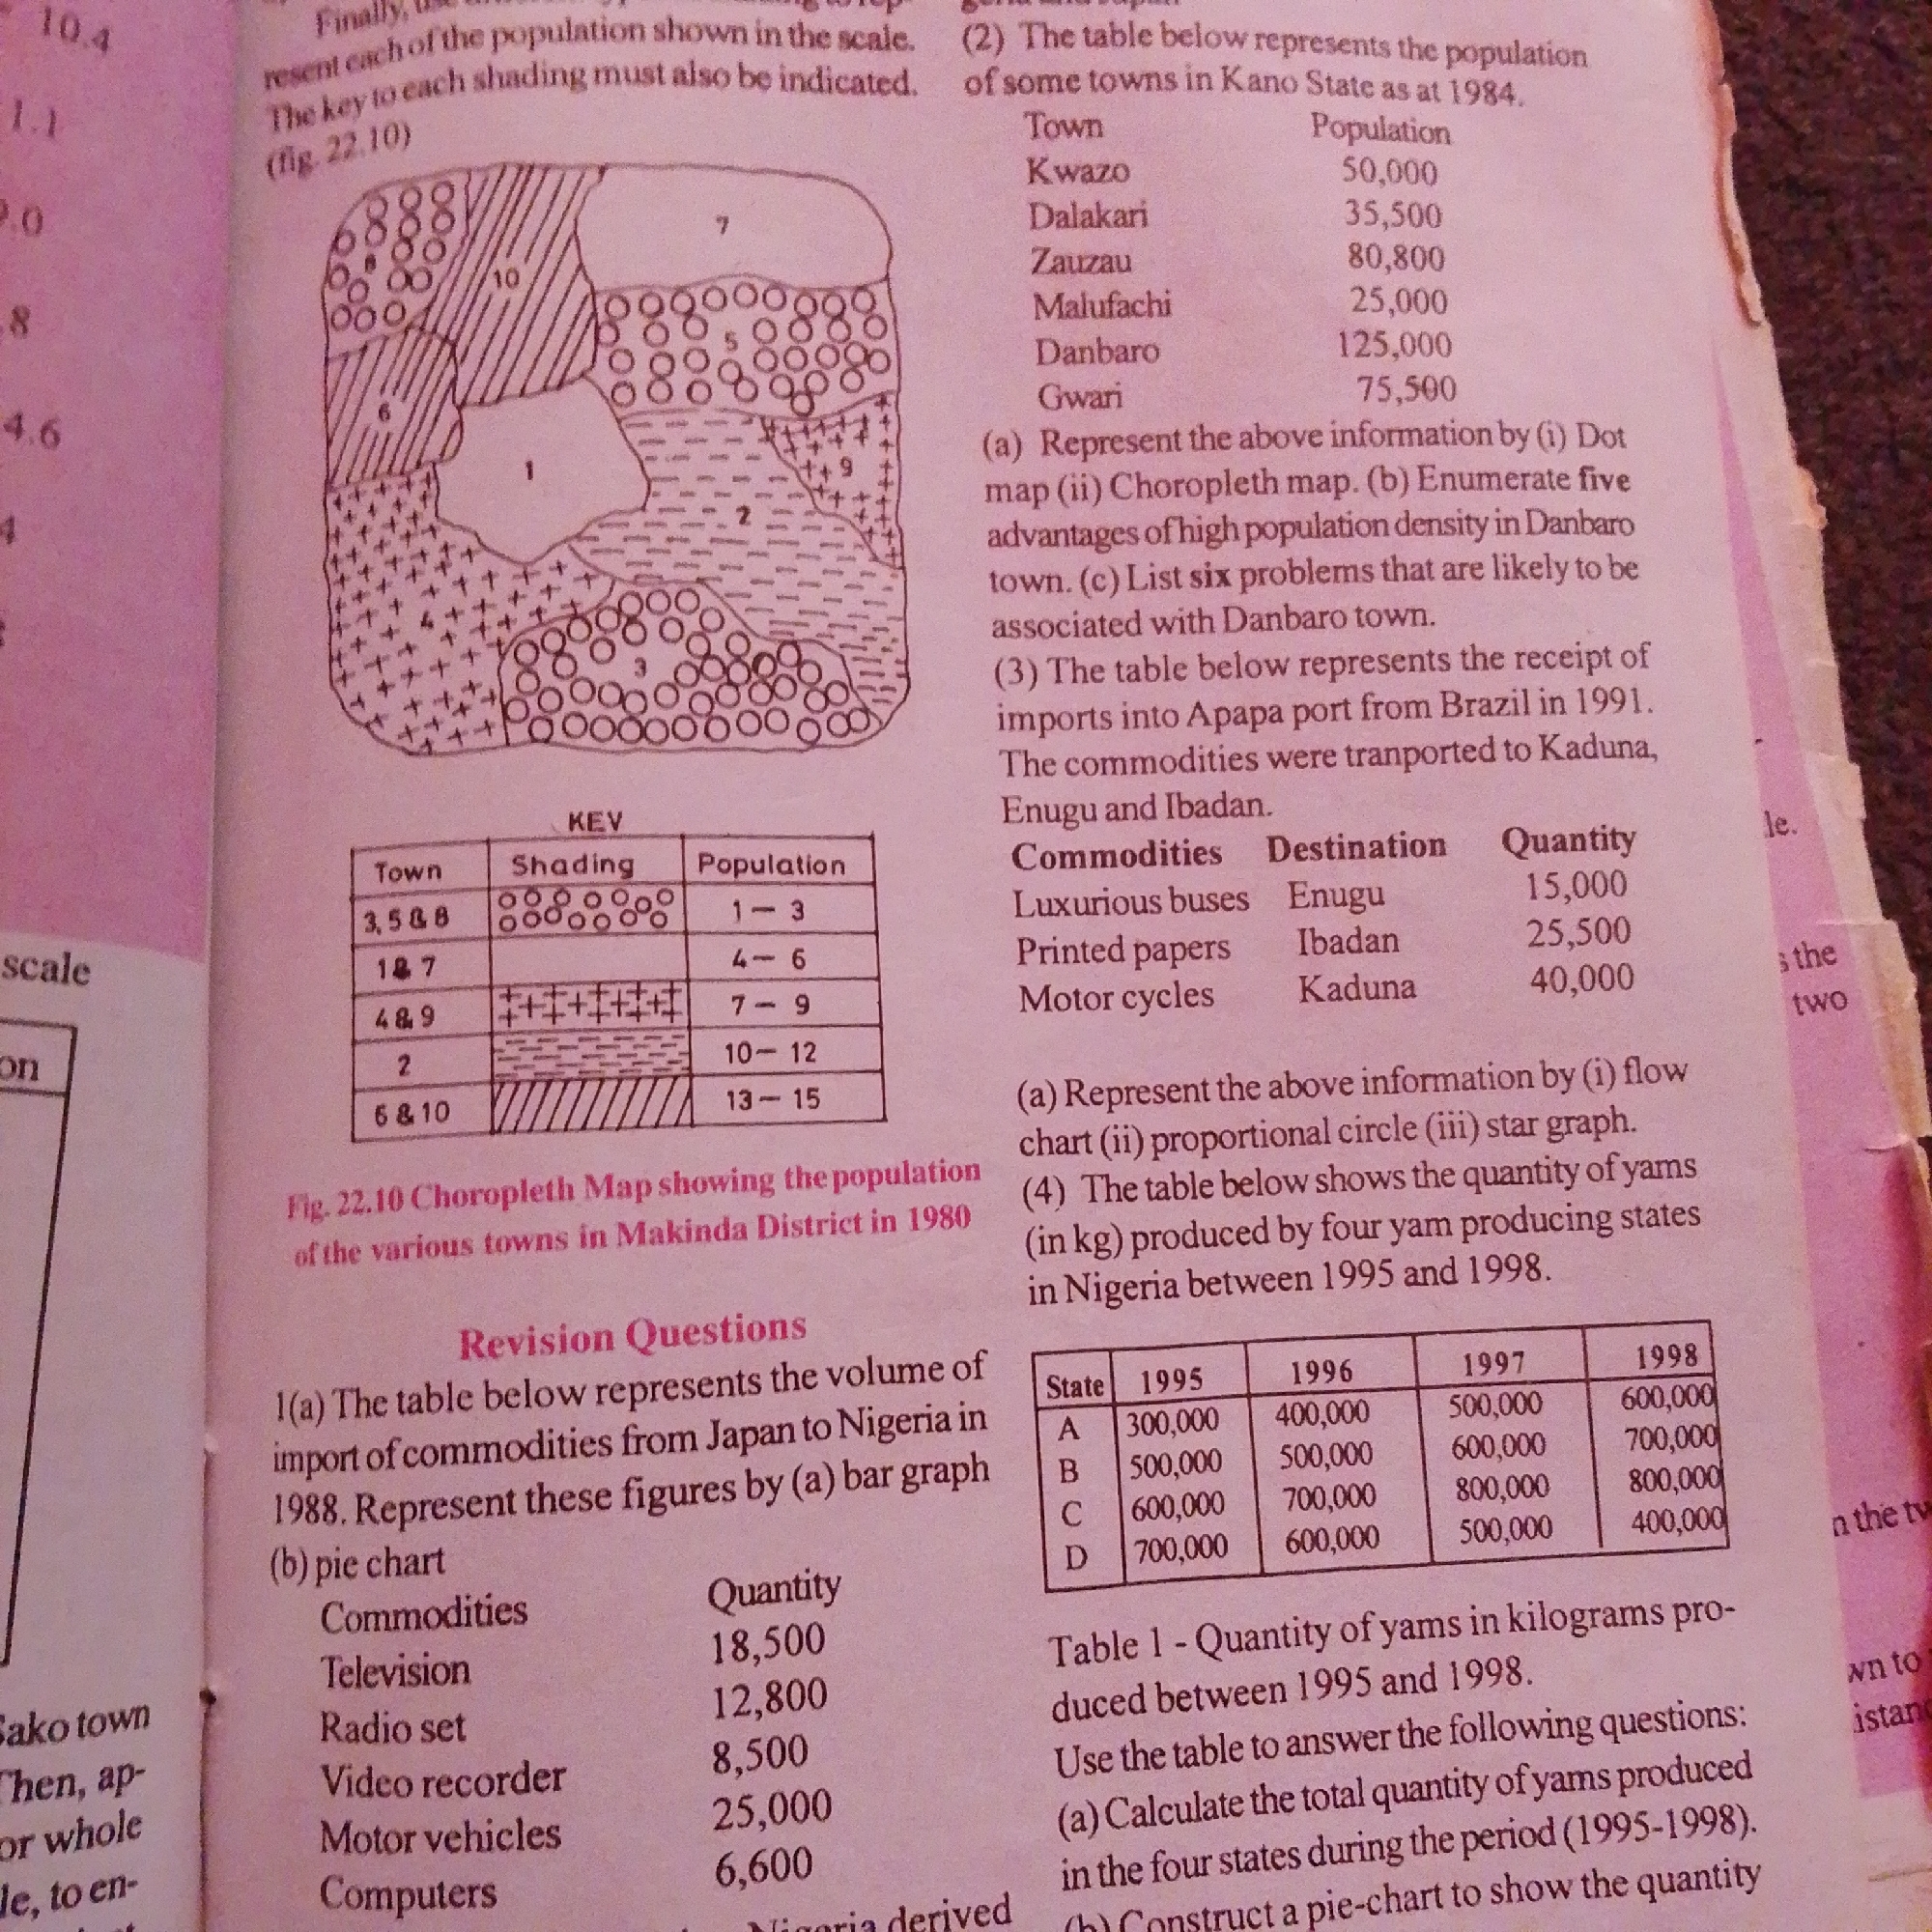
The image is a page from a geography textbook. It contains a choropleth map of Makinda District in Nigeria, showing population distribution in 1980. The map is accompanied by a key that links different shading patterns to population ranges for various numbered towns. To the right of the map are two tables. The first table lists towns in Kano State and their populations as of 1984, followed by questions related to representing this data and the population density in Danbaro. The second table shows the receipt of commodities into Apapa port from Brazil in 1991, with destinations and quantities. Below this, another table presents the quantity of yams produced by four states (A, B, C, D) between 1995 and 1998, followed by questions about calculating total yam production and constructing a pie chart. The bottom left of the image has a partial view of text possibly related to Sako town. There are no people visible in the image. The context suggests the location is Nigeria, with specific references to Kano State, Makinda District, and Apapa port.
Symbol
F3D5B
Volume
3,713
Creator
+$0.00
Revenue
+$0.01
TVL
$0.33
Loading AttnAds…

2

Rev Bot 🤖💰
Injected revenue 1mo ago
“Revenue bonus for the last stake.”
+$0.01 USD