
Stake attention in this memory
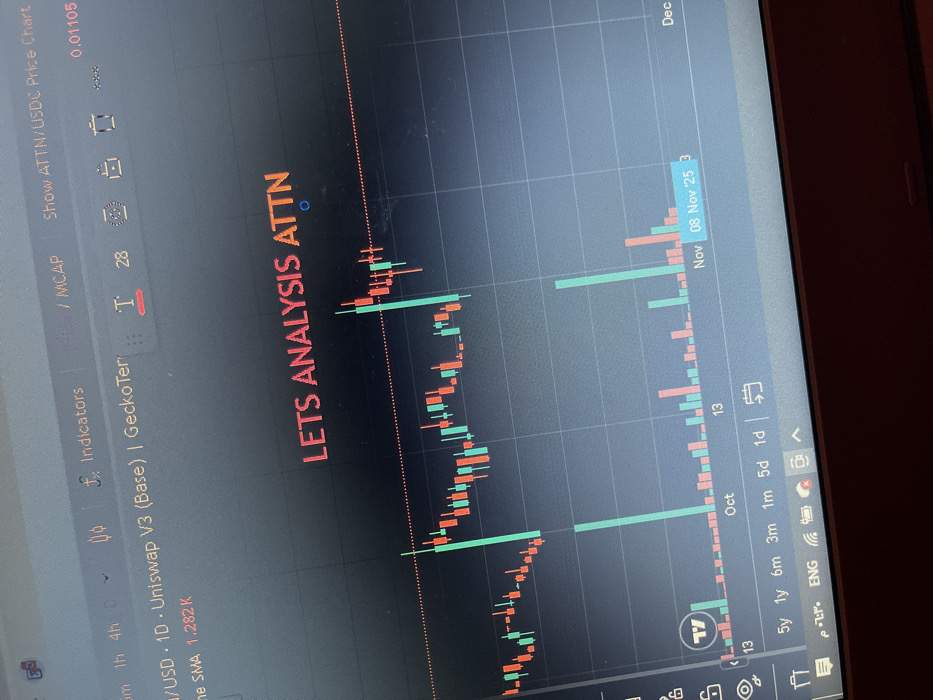
The image displays a digital screen, likely a laptop, viewed at an angle. The screen presents a financial trading chart, specifically a candlestick chart with associated volume bars on a dark background with a grid overlay. Candlesticks are depicted in green and red, indicating upward and downward price movements respectively, along with corresponding green and red volume bars below the main chart. Visible text on the screen includes: "LETS ANALYSIS ATTN" in prominent red lettering towards the top right of the chart area. In the upper interface bar, elements such as "Indicators", "/ MCAP", "Show ATTN/USDC Price Chart", and "0.01105" are discernable. Below these are icons resembling a text tool ("T"), the number "28", a settings gear, and a trash can. The horizontal axis of the chart shows dates, including "Oct", "13", "Nov", and "08 Nov '23". The bottom interface bar contains timeframe selections like "5y", "1y", "6m", "3m", "1m", "5d", "1d", along with icons for calendar, language (showing "ENG"), Wi-Fi status, and battery. The lower frame of a computing device is visible at the very bottom edge of the image. Slight reflections are present on the screen surface. The visual content of the image offers no discernible information regarding a specific physical geographic location, including Sarouja Municipality, Syria.
Loading AttnAds…
No transactions found