Stake attention in this memory
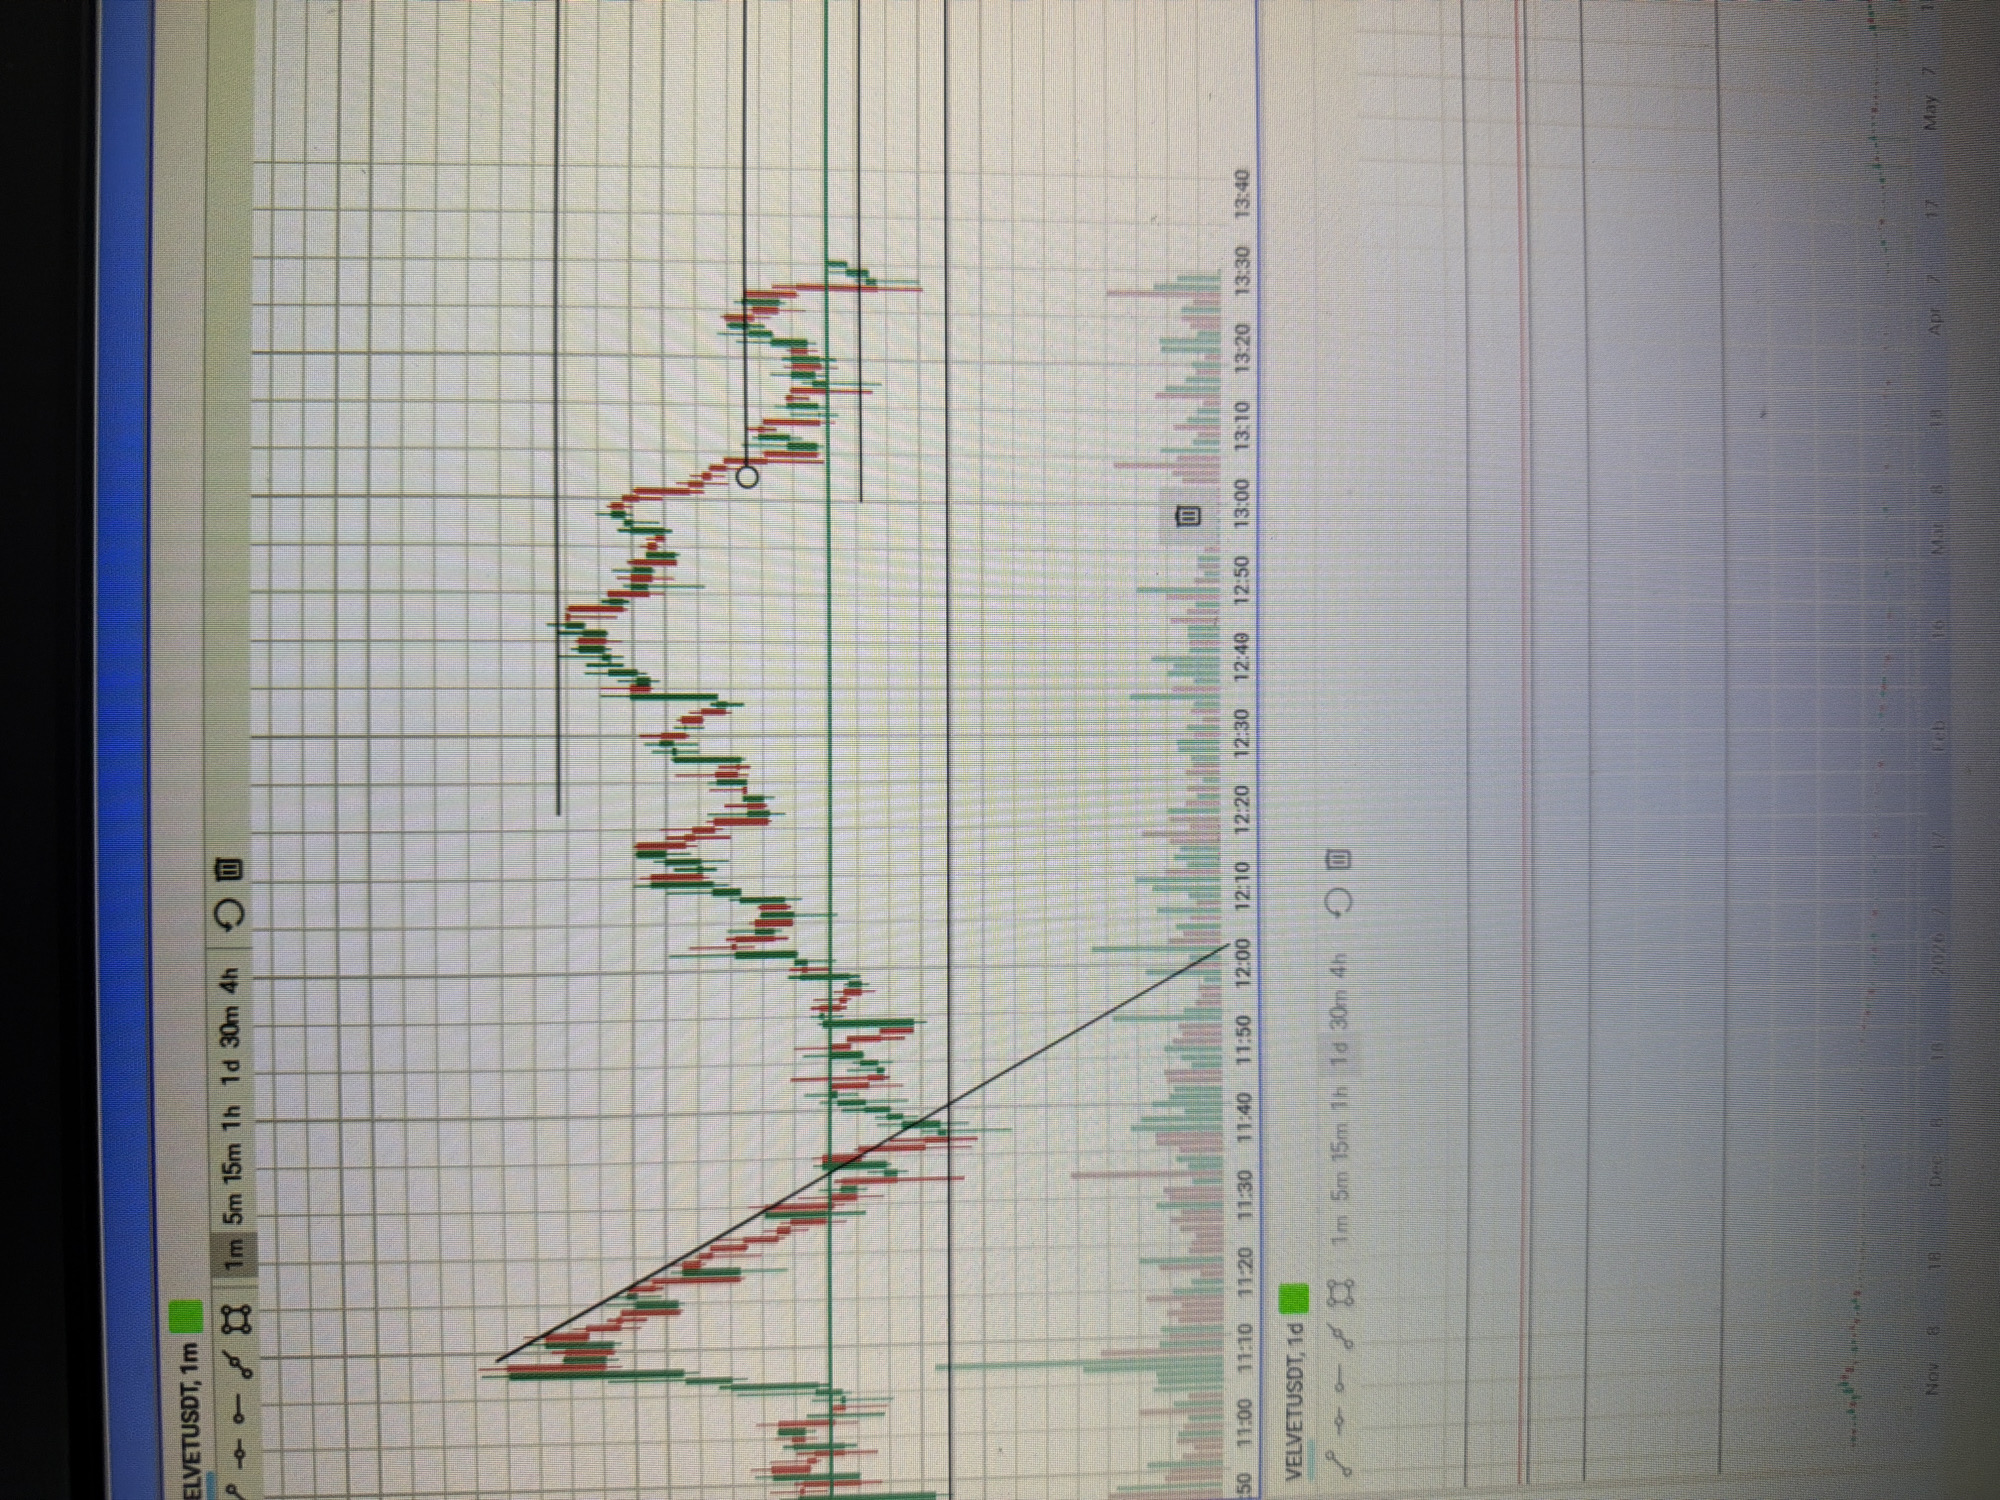
The image shows a computer screen displaying a financial trading chart, specifically the VELVETUSDT cryptocurrency. The chart depicts price movements over time, with green and red bars representing increases and decreases in value, respectively. Several horizontal lines are drawn on the chart, likely indicating support and resistance levels. A downward sloping black line is also visible, possibly representing a trend line. The chart includes a volume indicator at the bottom, showing trading activity. The timestamp at the bottom indicates the chart is displaying data from approximately 10:50 AM to 1:40 PM. There are no people, animals, or any visible indications of a specific geographical location like Chelyabinsk, Russia, within the image. The context is purely digital and related to financial market analysis.
No transactions found