
Stake attention in this memory
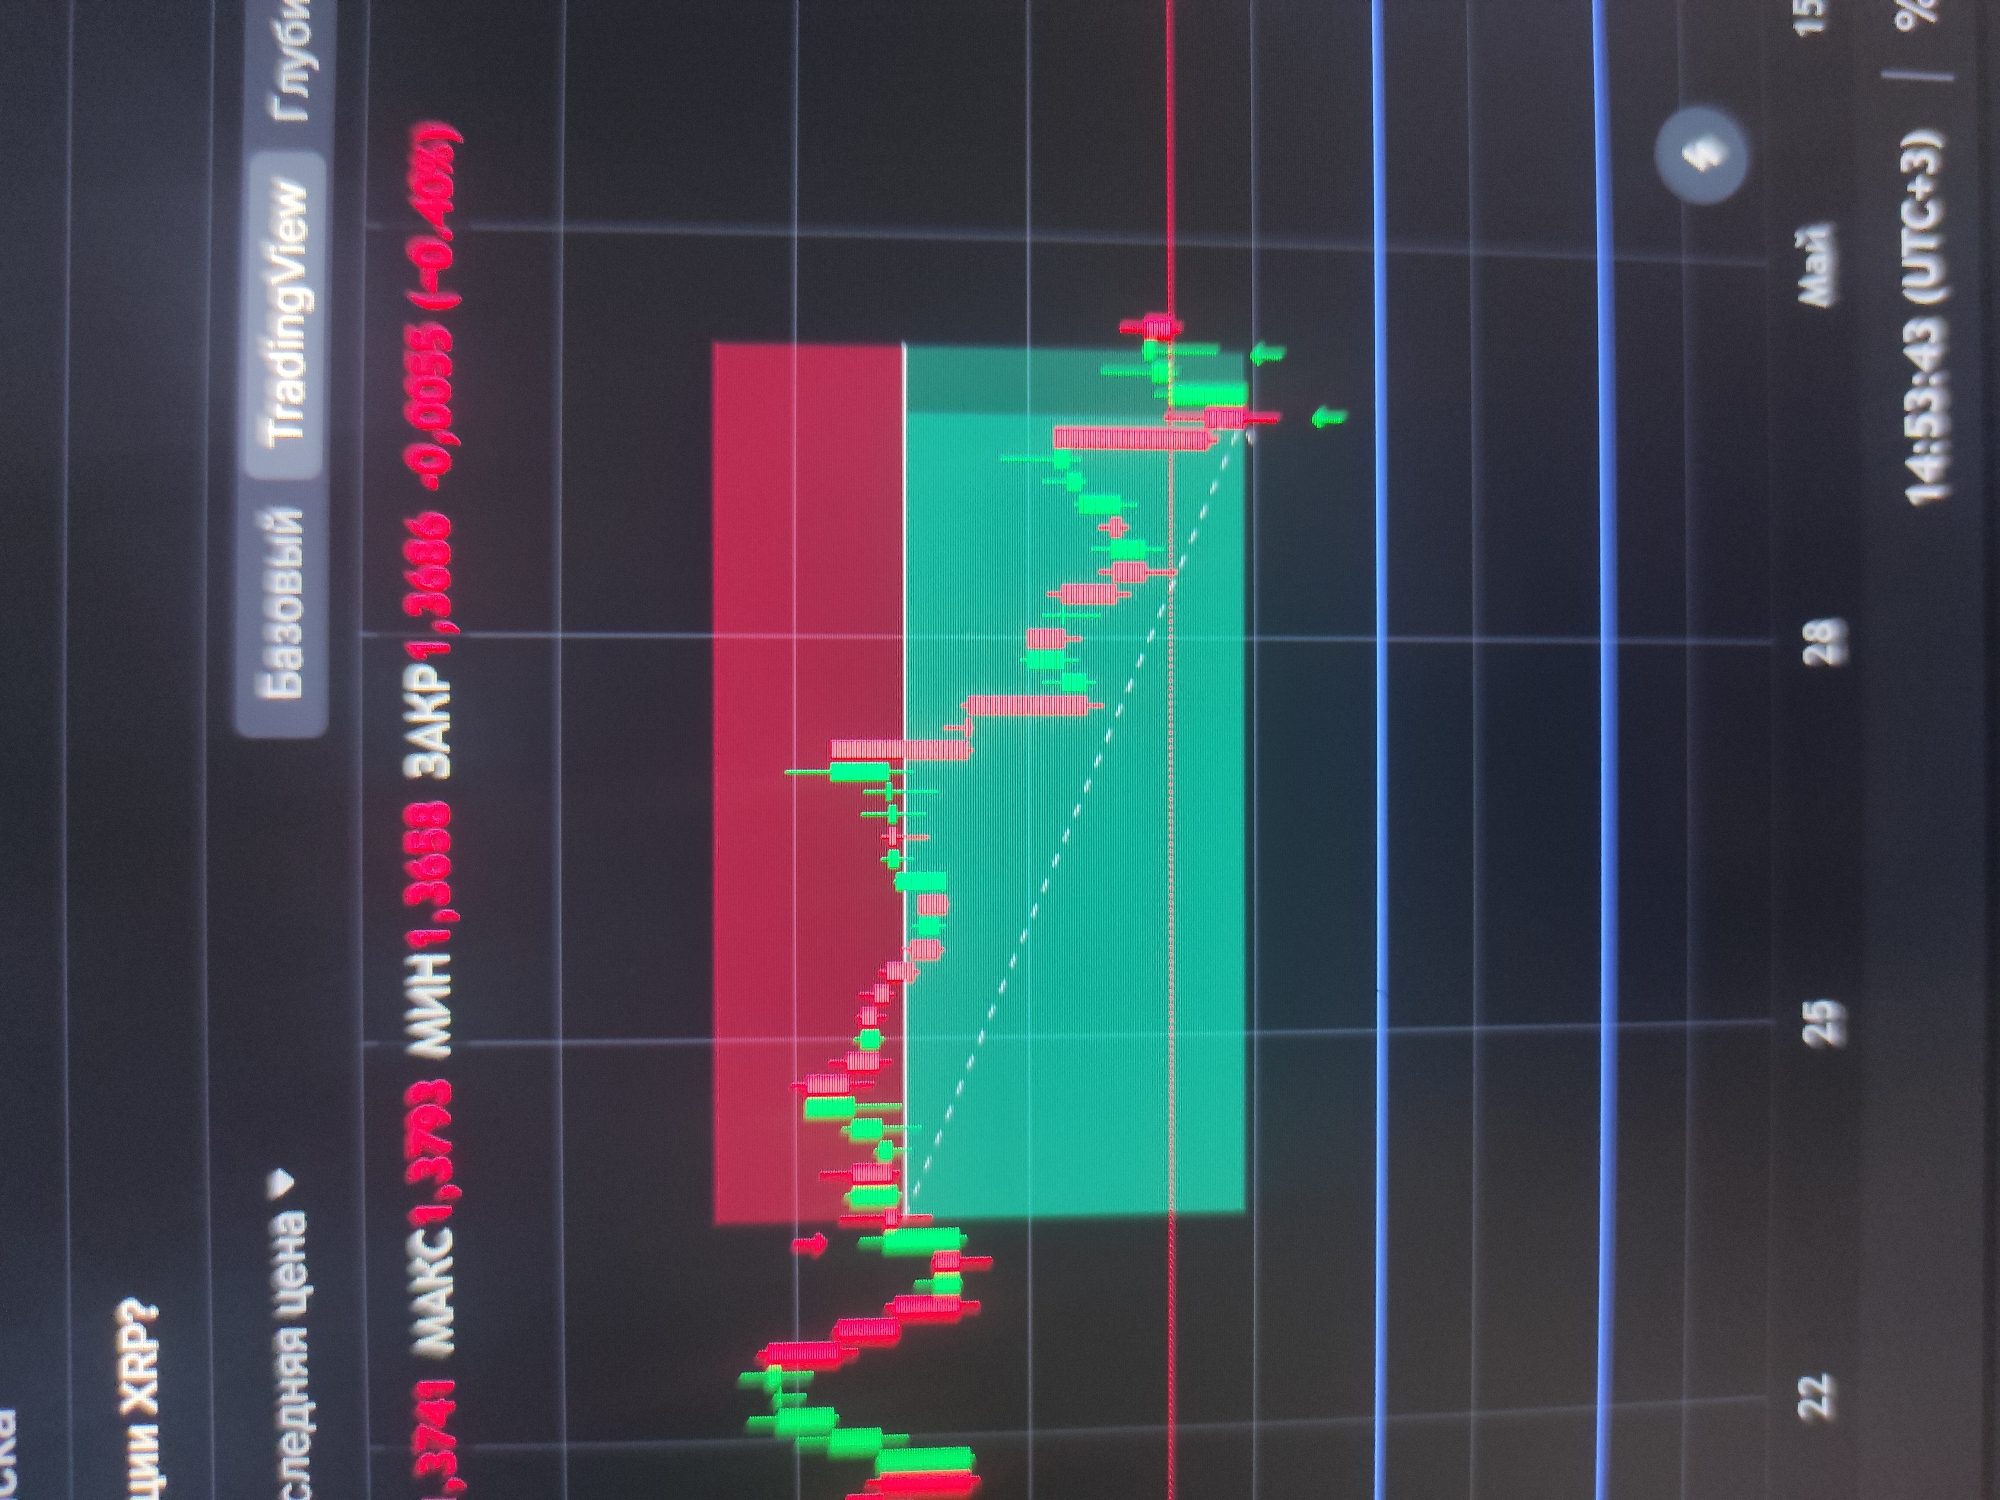
The image displays a close-up, rotated view of a digital screen presenting a financial trading chart, likely for cryptocurrency or stock analysis. The screen shows a candlestick chart with red and green candles indicating price movements over time. A prominent graphical overlay consists of large, semi-transparent red and green rectangles, typically used in trading to define price ranges, profit targets, or stop-loss levels. A dashed white line traverses the green section, suggesting a trend or level. No people are visible in the frame. The setting appears to be a dark-themed interface, possibly a trading platform on a computer monitor or tablet. The background is predominantly black with blue grid lines. Visible Russian text includes "ции XRP?" (likely referring to XRP cryptocurrency positions or shares), "последняя цена" (last price), "Базовый" (Basic), "TradingView" (a popular charting service), and "Глуби" (Depth, possibly referring to market depth). Specific financial data is displayed: "1,3741 МАКС 1,3793 МИН 1,3653 ЗАКР 1,3636 -0,0055 (-0.40%)", indicating the last price, maximum, minimum, closing price, and a negative change of 0.0055 units or 0.40%. Date markers "22", "25", "28" and the month "Май" (May) are visible along the bottom axis, indicating a timeline. The current time is shown as "14:53:43 (UTC+3)", which corresponds to 2:53 PM in a timezone covering Eastern Europe, including Sevastopol. The image captures the dynamic display of financial market data, focusing on price action and analytical tools.
Loading AttnAds…
No transactions found