Mar 11, 2026, 12:57 PM
Stake attention in this memory
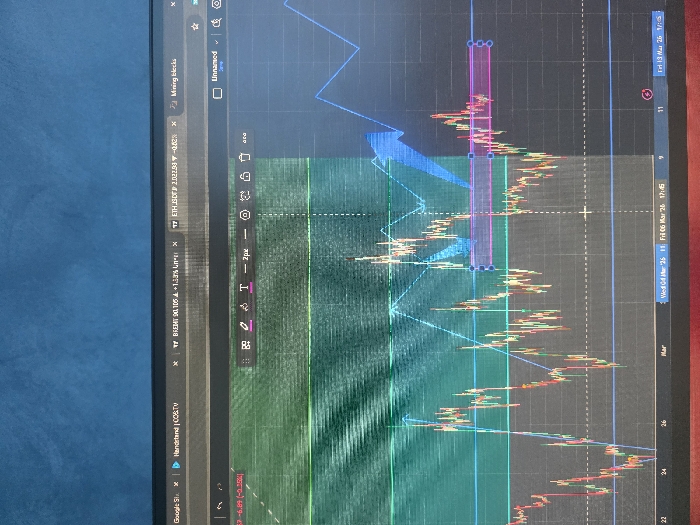
The image displays a computer monitor or laptop screen at an upward angle, showing a dark interface with financial trading charts and open browser tabs. The screen occupies the majority of the frame, with a blue, textured surface visible reflected above it. No specific city or location is identifiable. The active application on the screen features a candlestick chart against a dark background, showing price movements over time. Overlaid on the chart are several graphical elements: - A prominent blue, jagged line indicating a potential trend or prediction, extending across the upper portion of the chart. - Two horizontal, translucent pink rectangular zones, likely indicating support or resistance levels, are positioned over candlestick clusters. - A translucent green horizontal band extends across the upper-left quadrant of the chart. - Vertical grid lines and a horizontal axis with dates "Wed 04 Mar 26," "Fri 06 Mar 26," and "Fri 13 Mar 26" are visible at the bottom. - A blue upward-pointing arrow or shape is present on the right side of the chart, superimposed on the candlesticks. - A toolbar is visible at the top of the chart area with icons including a grid, undo/redo, pen, text, line thickness (labeled "2px"), eye, lock, and trash can. Above the chart, several browser tabs are open and partially visible, displaying text: "Google St...", "Handstand | COB.TV", "BRENT 90.105 ▲ +1.33%", "ETH/USD (P 2,022.83 ▼ -0.62%)", and "Mining blocks". To the right of the tabs, a search bar labeled "Unnamed" and various browser icons (star, download, settings) are present. No individuals or direct human interactions are depicted.
No transactions found
More from this user

