Stake attention in this memory
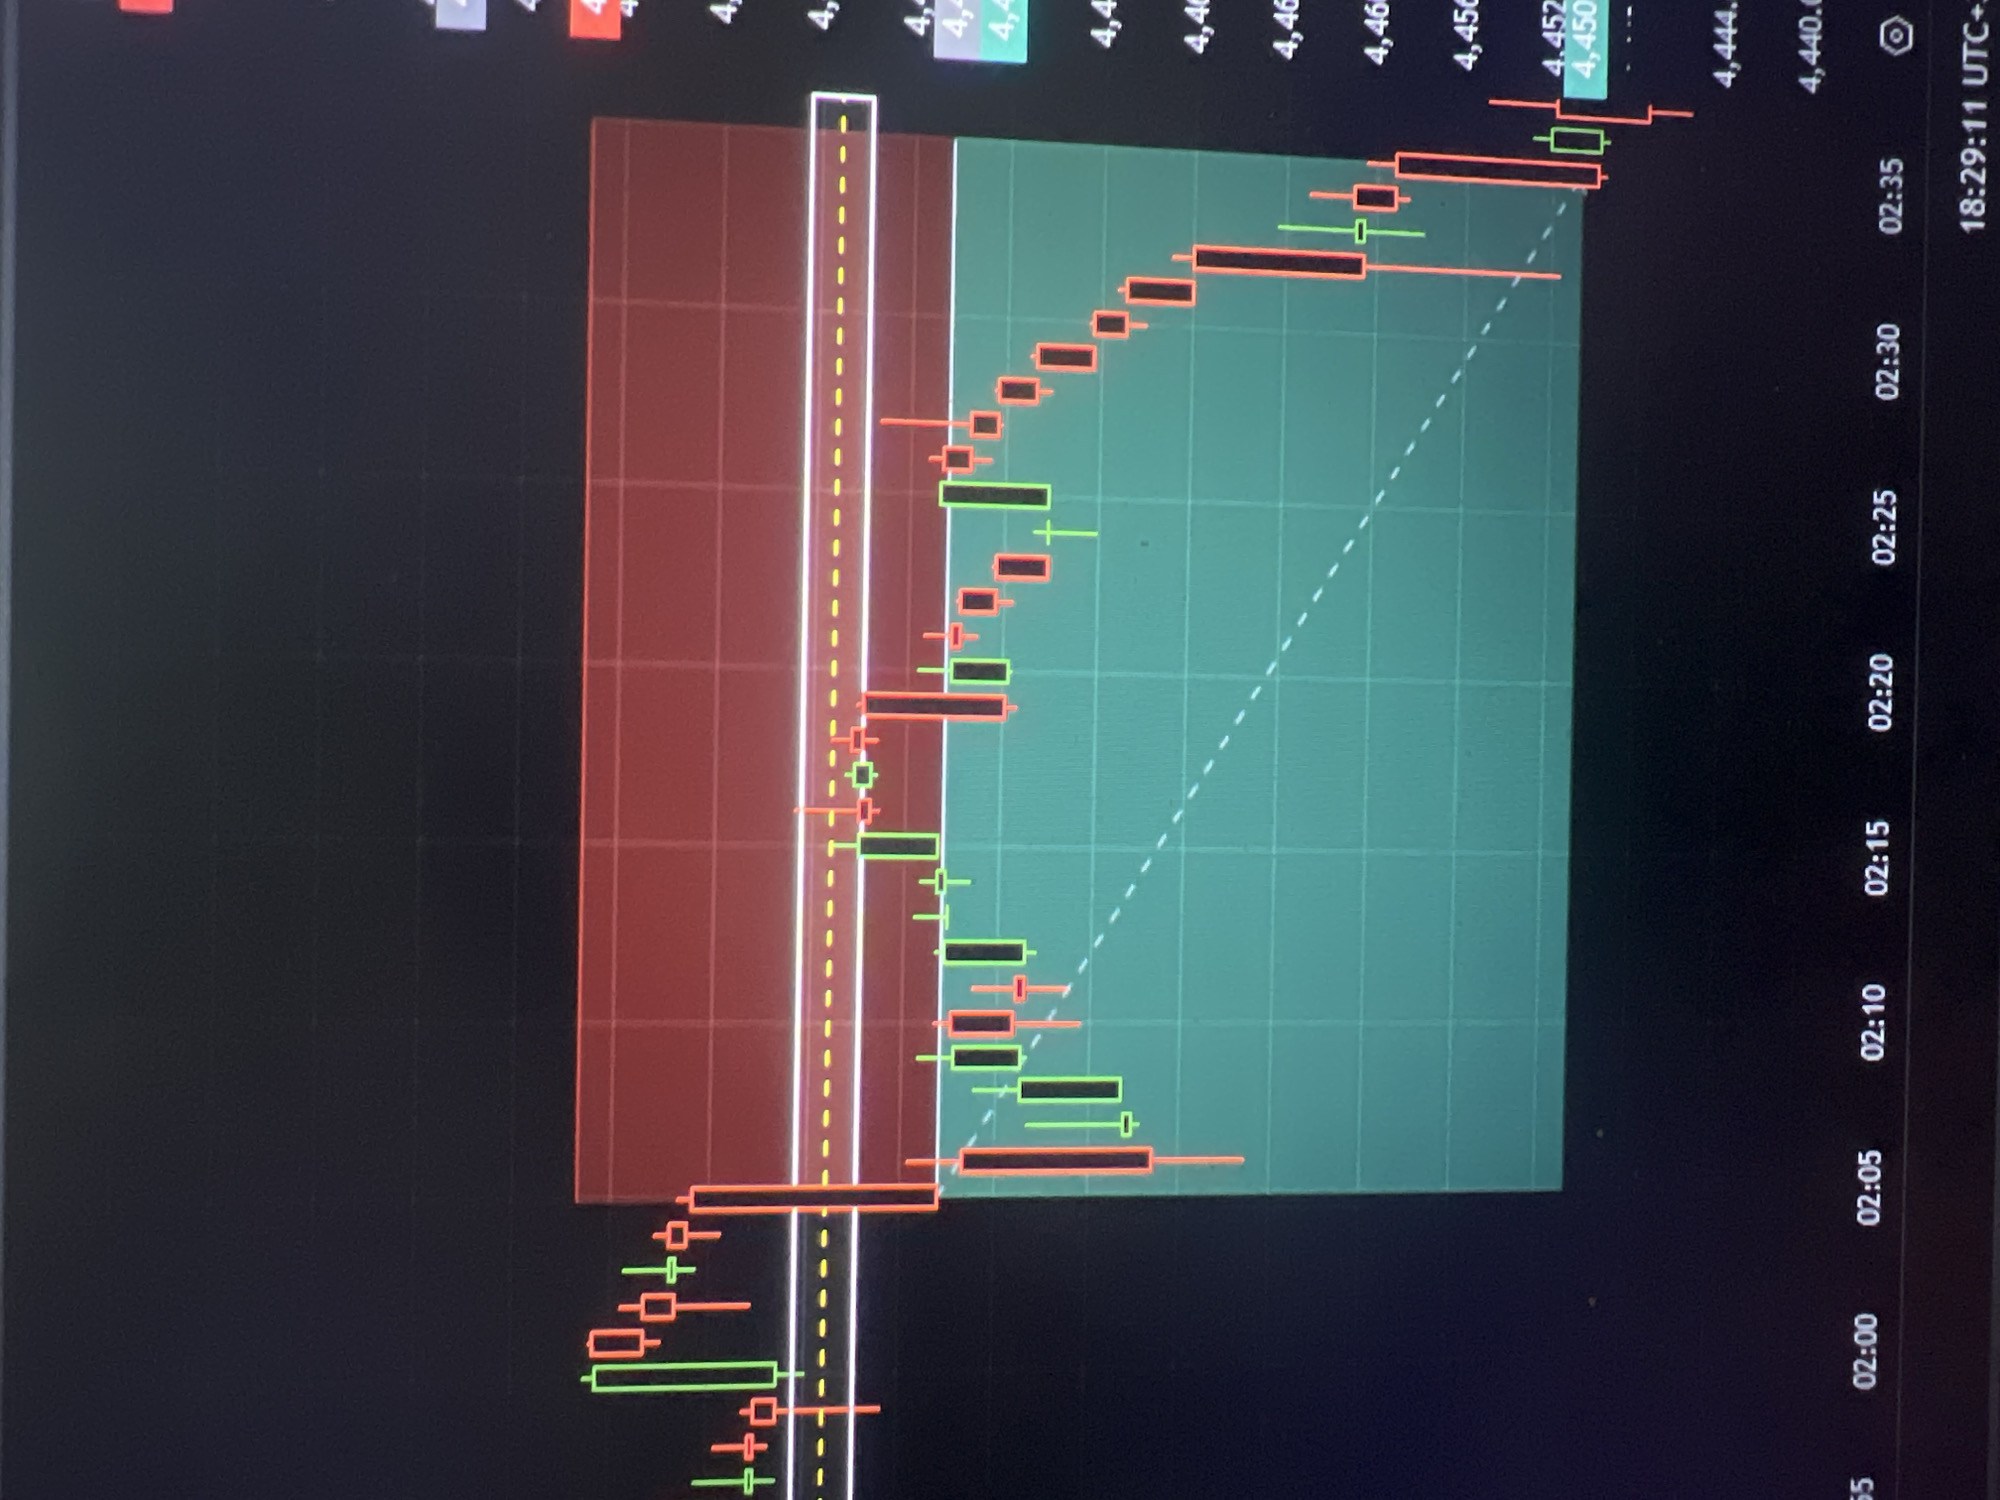
The image shows a candlestick chart, commonly used in financial analysis, displayed on a screen. The chart plots price fluctuations over time, with the x-axis showing the time (02:00 to 02:35) and the y-axis showing the price (from 4,440.0 to 4,466). The candlesticks themselves represent price movements within a specific time interval. Green candlesticks indicate that the price closed higher than it opened, while red candlesticks indicate that the price closed lower than it opened. The chart is overlaid with a red rectangle on the left side and a green rectangle on the right side. A dashed white line runs vertically through the chart, with a dotted yellow line adjacent to it. The timestamp in the upper-right corner of the screen indicates 18:29:11 UTC+.
Symbol
2529B
Volume
439
Creator
+$0.00
Revenue
+$0.00
TVL
$0.02
Loading AttnAds…

More from this user
More from Unknown