Stake attention in this memory
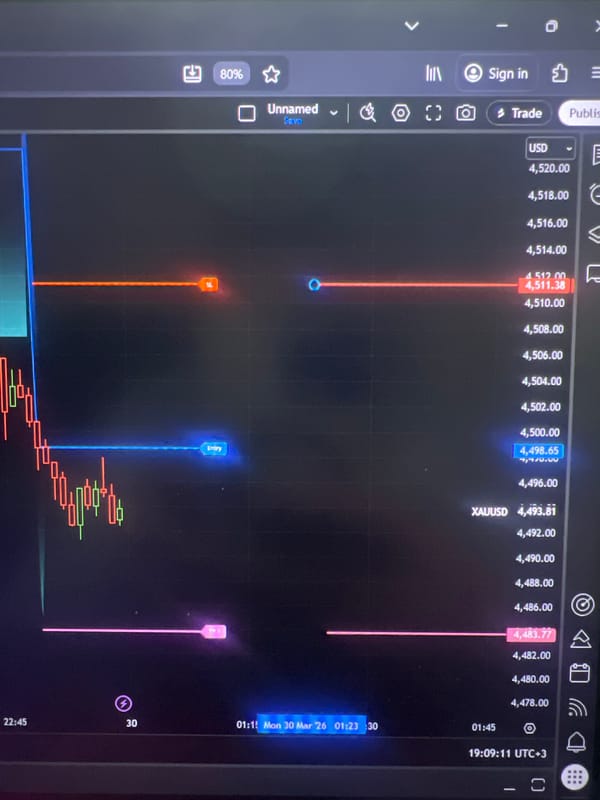
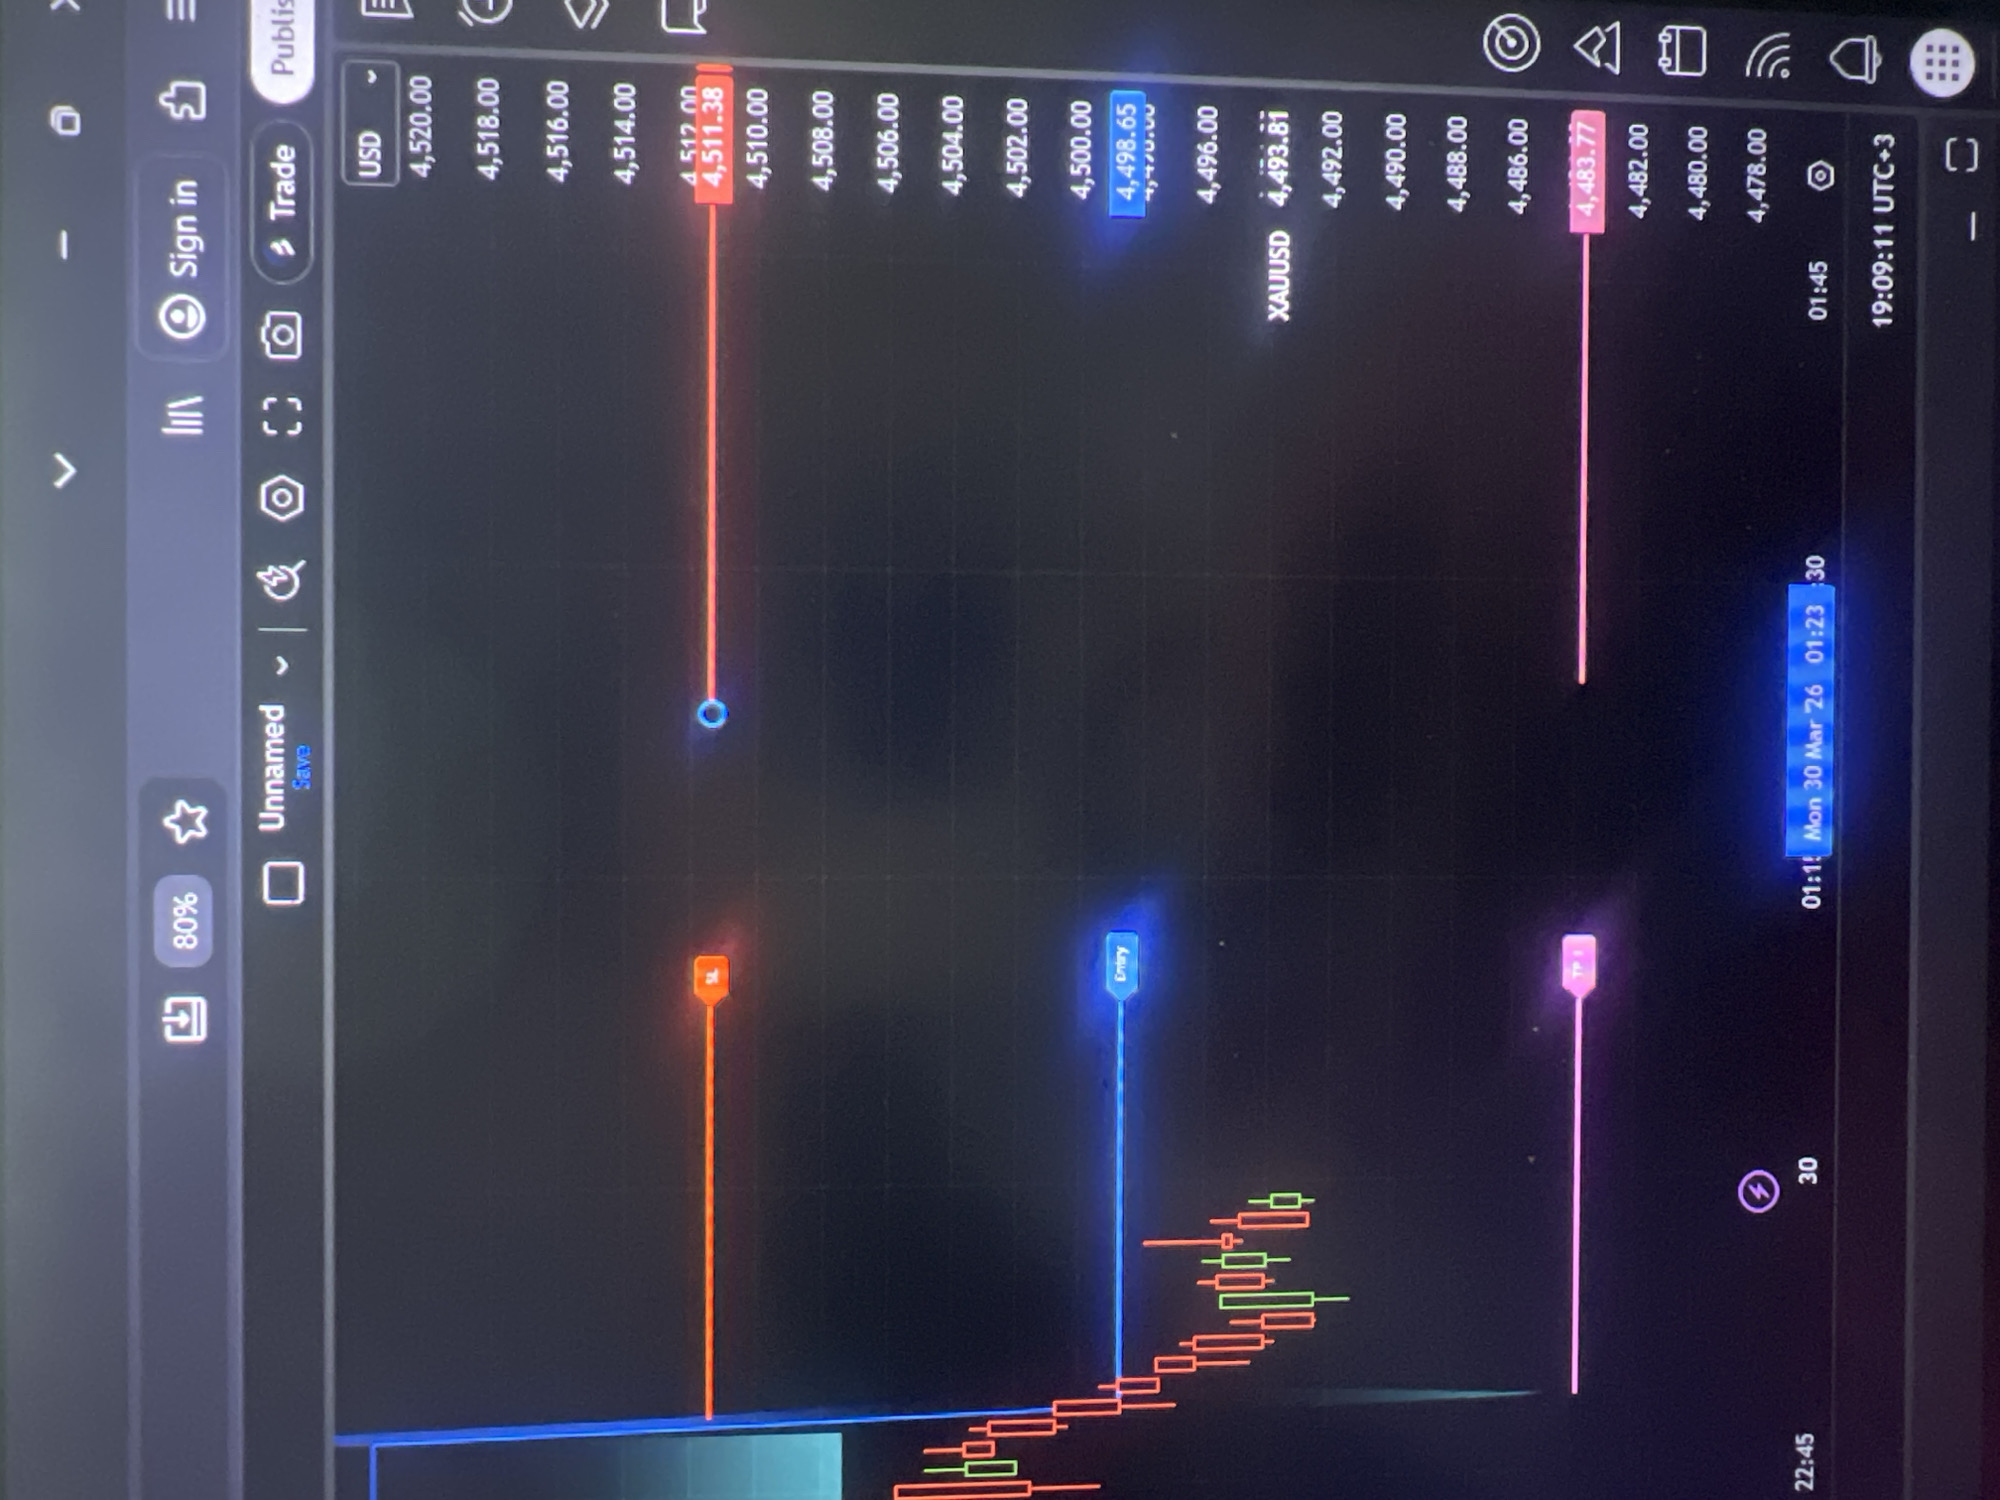
The image shows a screen displaying a trading chart, likely for XAUUSD (Gold versus US Dollar). The chart has candlestick patterns indicating price fluctuations over time. There are three horizontal lines marked with different colors: one at 4,511.38 USD, labeled with an orange indicator; one at 4,498.65 USD, labeled "Entry" with a blue indicator; and another at 4,483.77 USD, labeled "TP1" with a pink indicator. The chart spans the period around 01:11 on Monday, March 30, 2026, with the current time at 19:09:11 UTC+3. The user interface elements on the left side suggest a trading platform application with options like signing in, trading, and saving the chart with a zoomed-in view of 80%.
Symbol
D1193
Volume
5,886
Creator
+$0.00
Revenue
+$0.00
TVL
$0.73
Loading AttnAds…

More from this user
More from Unknown